Adults with Disabilities: Ethnicity and Race
Description
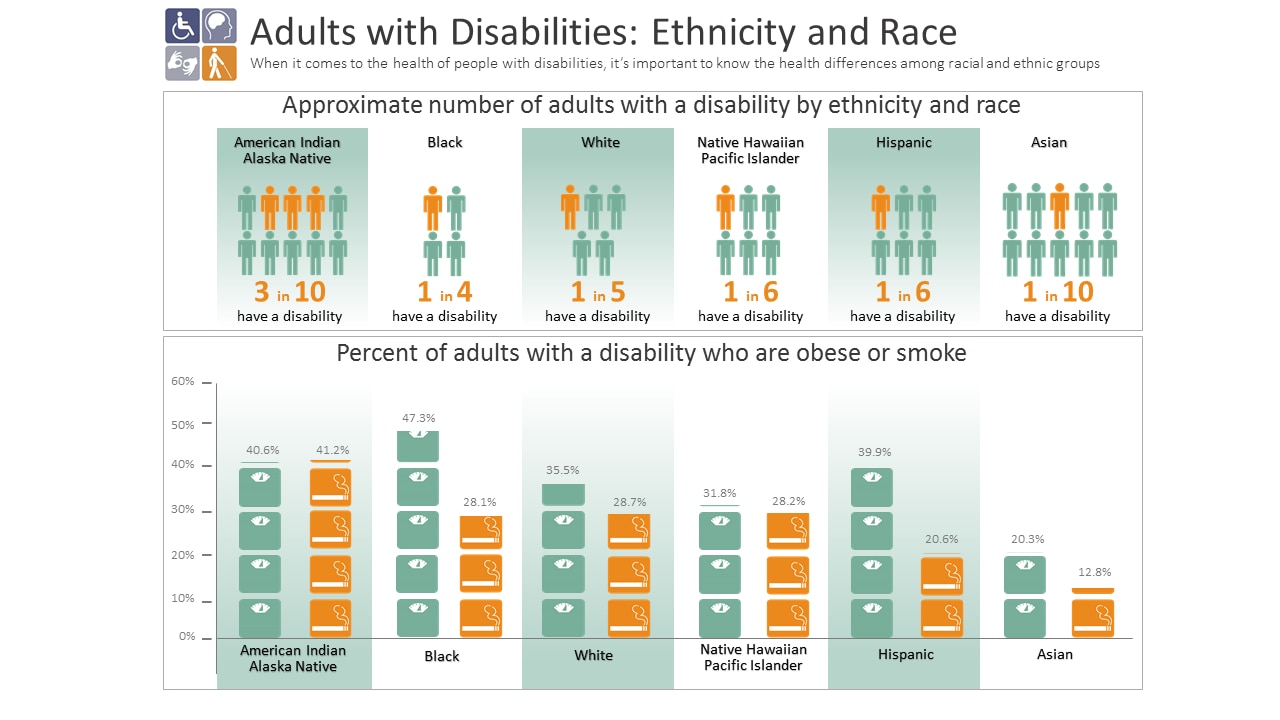
Adults with Disabilities: Ethnicity and Race
When it comes to the health of people with disabilities, it’s important to know the health differences among racial and ethnic groups
Approximate number of adults with a disability by ethnicity and race.
American Indian / Alaska Native:
- 3 in 10 have a disability
Black:
- 1 in 4 have a disability
White:
- 1 in 5 have a disability
Native Hawaiian / Pacific Islander:
- 1 in 6 have a disability
Hispanic:
- 1 in 6 have a disability
Asian:
- 1 in 10 have a disability
Percentage of adults with a disability who are obese or smoke.
American Indian / Alaska Native:
- 40.6% are obese
- 41.2% smoke
Black:
- 47.3% are obese
- 28.1% smoke
White:
- 35.5% are obese
- 28.7% smoke
Native Hawaiian / Pacific Islander:
- 31.8% are obese
- 28.2% smoke
Hispanic:
- 39.9% are obese
- 20.6% smoke
Asian:
- 20.3% are obese
- 12.8% smoke


.png)


No hay comentarios:
Publicar un comentario