| MMWR Weekly (No. 13) PDF of this issue |
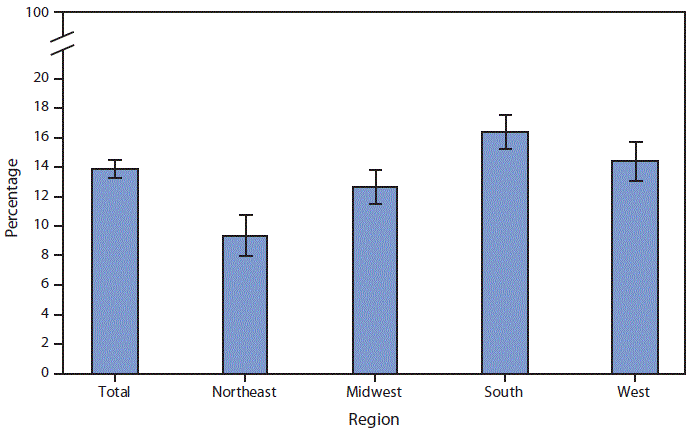
QuickStats: Age-Adjusted Percentages* of Adults Aged ≥18 Years Without a Usual Place of Health Care,† by Region§ — National Health Interview Survey, 2017¶
Weekly / April 5, 2019 / 68(13);319

* With 95% confidence intervals indicated with error bars.
† Based on a survey question that asked respondents, “Is there a place that you usually go to when you are sick or need advice about your health? ”Persons who responded with a “yes” or “there is more than one place ”were considered to have a usual place of health care, and persons who said “there is no place” were considered to be without a usual place of health care. Respondents who refused to answer or said they didn’t know were considered unknown and excluded from the analysis.
§ Northeast: Connecticut, Maine, Massachusetts, New Hampshire, New Jersey, New York, Pennsylvania, Rhode Island, and Vermont. Midwest: Illinois, Indiana, Iowa, Kansas, Michigan, Minnesota, Missouri, Nebraska, North Dakota, Ohio, South Dakota, and Wisconsin. South: Alabama, Arkansas, Delaware, District of Columbia, Florida, Georgia, Kentucky, Louisiana, Maryland, Mississippi, North Carolina, Oklahoma, South Carolina, Tennessee, Texas, Virginia, and West Virginia. West: Alaska, Arizona, California, Colorado, Hawaii, Idaho, Montana, Nevada, New Mexico, Oregon, Utah, Washington, and Wyoming.
¶ Estimates are based on household interviews of a sample of the civilian, noninstitutionalized U.S. population, are shown for sample adults aged ≥18 years, and are age-adjusted using the projected 2000 U.S. population as the standard population and using four age groups: 18–44, 45–64, 65–74, and ≥75 years.
Among adults aged ≥18 years, 13.9% were without a usual place of health care in 2017. Adults in the South (16.4%) were more likely be without a usual place of health care compared with adults in the West (14.4%) and Midwest (12.7%). Adults in the Northeast (9.4%) were least likely to be without a usual place of health care.
Source: Tables of Summary Health Statistics, 2017. https://ftp.cdc.gov/pub/Health_Statistics/NCHS/NHIS/SHS/2017_SHS_Table_A-16.pdf.
Reported by: Debra L. Blackwell, PhD, DBlackwell@cdc.gov, 301-458-4103; Maria A. Villarroel, PhD.


No hay comentarios:
Publicar un comentario