
QuickStats: Percentage* of Adults Aged ≥65 Years Who Saw Selected Types of Health Professionals† in the Past 12 Months, by Diagnosed Diabetes Status§ — National Health Interview Survey, 2015
Weekly / May 19, 2017 / 66(19);517
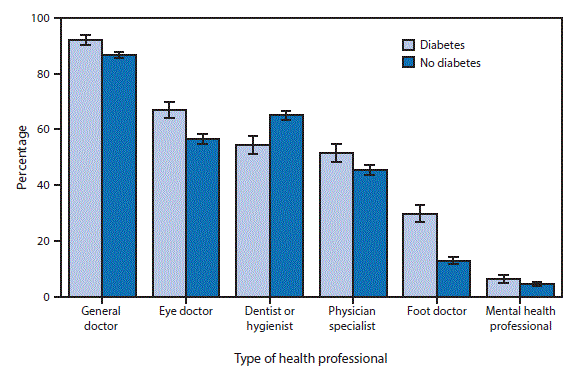
* With 95% confidence intervals indicated by error bars.
† Based on responses to the following questions: “During the past 12 months, have you seen or talked to any of the following health care providers about your own health? A general doctor who treats a variety of illnesses (a doctor in general practice, family medicine, or internal medicine)? An optometrist, ophthalmologist, or eye doctor (someone who prescribes eyeglasses)? A medical doctor who specializes in a particular medical disease or problem (other than obstetrician/gynecologist, psychiatrist, or ophthalmologist)? A foot doctor? A mental health professional such as a psychiatrist, psychologist, psychiatric nurse, or clinical social worker? About how long has it been since you last saw a dentist, including all types of dentists, such as orthodontists, oral surgeons, and all other dental specialists, as well as dental hygienists?”
§ Diabetes status was determined by a positive response to the survey question, “Have you ever been told by a doctor or other health professional that you have diabetes or sugar diabetes?” Women were asked not to include diabetes occurring during pregnancy.
In 2015, adults aged ≥65 years with diagnosed diabetes were more likely than adults without diagnosed diabetes to report seeing general doctors (92.3% compared with 86.7%); eye doctors (66.9% compared with 56.6%); physician specialists (51.5% compared with 45.5%); foot doctors (29.9% compared with 13.0%) and mental health professionals (6.3% compared with 4.5%) in the past 12 months. Those with diabetes were less likely than those without diabetes to report seeing a dentist or dental hygienist in the past 12 months (54.5% compared with 65.0%).
Source: National Health Interview Survey, 2015 data. https://www.cdc.gov/nchs/nhis.htm.
Source: National Health Interview Survey, 2015 data. https://www.cdc.gov/nchs/nhis.htm.
Reported by: Sarah E. Lessem, PhD, slessem@cdc.gov, 301-458-4209; Robin P. Pendley, DrPH.


.png)


No hay comentarios:
Publicar un comentario