Interactive heat map shows childhood asthma burden caused by air pollution
A team of air quality and health researchers led by the Texas A&M Transportation Institute (TTI) has created a first-of-its-kind, county-by-county interactive heat map and city-by-city table detailing the distribution of childhood asthma due to traffic-related air pollution across the United States.
One of the principal findings is that asthma cases attributable to traffic-related air pollution dramatically decreased over a 10-year period.
A research paper, Traffic-Related Air Pollution and the Burden of Childhood Asthma in the Contiguous United States in 2000 and 2010, detailing the findings has been accepted for publication in the peer-reviewed journal Environment International.
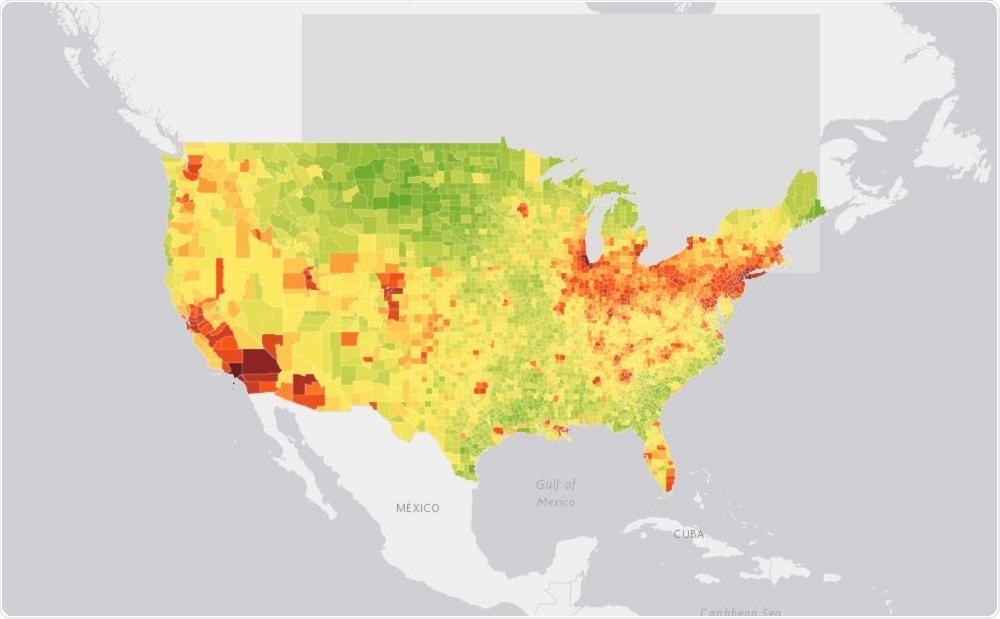
Khreis and her team created an interactive heat map showing the impact NO2 had on childhood asthma across the country during the years 2000 and 2010. Every U.S. county is represented, and users can hover over a county to see the findings for that county. Also, a table of the largest 498 cities across the country with detailed information for each year is presented.
For example, for Harris County (home to Houston, Texas), the map details the population of children in the county, the number and percentage of childhood asthma cases attributable to NO2, and the average NO2 concentration for the year.
In 2000, there were 2,682 asthma cases attributable to traffic-related pollution, representing 25 percent of all asthma cases in the county. In 2010, there were four hundred fewer air pollution-related cases, representing 18 percent of all asthma cases in the county for that year and a 23.7 percent decrease from 2000.
(In Texas, Houston and Dallas rank in the top 10 cities with traffic-related air pollution [TRAP] asthma cases.)
TTI estimates there were more than 140,000 asthma cases due to TRAP in the United States in 2010. More than 80 percent of children with TRAP-induced asthma live in urban areas. Low-income households are especially vulnerable.
The heat map can help better inform air quality policy makers, transportation agencies, medical associations and anyone else interested in learning more about the burden of childhood asthma due to air pollution. The research team is currently refining this analysis by using state-specific health data from surveys by the Centers for Disease Control and Prevention.
“This study highlights the issue of TRAP-related asthma and pinpoints those cities where air quality and asthma continue to be a major problem,” Khreis points out. “Despite the encouraging decrease in air pollution-related asthma cases, of those cases that remain, many could and should be prevented.”


.png)

.png)


No hay comentarios:
Publicar un comentario