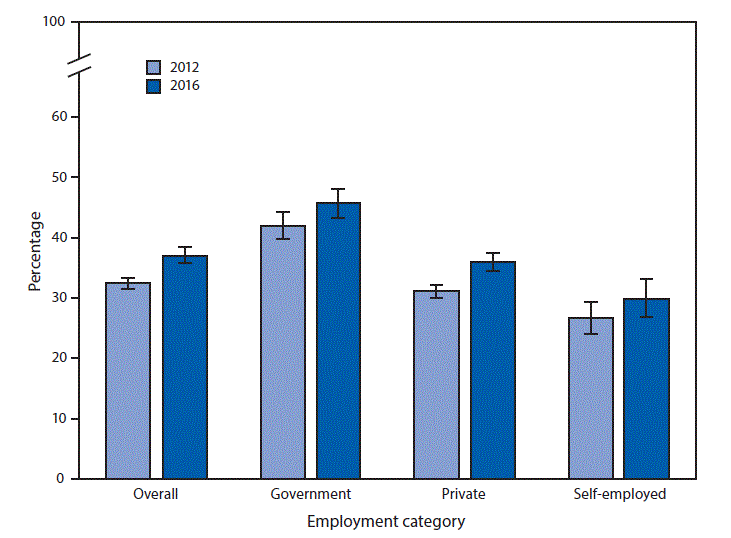
QuickStats: Percentage* of Currently Employed† Adults Aged ≥18 Years Who Received Influenza Vaccine in the Past 12 Months,§ by Employment Category¶ — National Health Interview Survey,** United States, 2012 and 2016
Weekly / April 27, 2018 / 67(16);480

* With 95% confidence intervals shown with error bars.
† Working for pay at a job or business, or with a job or business but not at work, in the week prior to the survey.
§ Based on a positive response to the following questions: in 2012, to either “During the past 12 months, have you had a flu shot” or to “During the past 12 months, have you had a flu vaccine sprayed in your nose by a doctor or other health professional?,” and in 2016 to the question “During the past 12 months, have you had a flu vaccination?”
¶ Based on the response to a question that asks for the category that best describes the respondent’s current job or work situation. Only selected categories are shown. Federal, state, and local government employees are aggregated in the figure as government employees. The employment category might not reflect the adult’s employment at the time of the vaccination.
** Estimates are based on household interviews of a sample of the noninstitutionalized U.S. civilian population and are derived from the National Health Interview Survey Sample Adult component.
From 2012 to 2016, the percentage of employed adults who had received an influenza vaccine in the past 12 months increased overall (32.4% versus 37.0%), among government employees (42.0% versus 45.6%), and private-sector employees (31.1% versus 36.0%), but there was no significant increase among the self-employed (26.5% versus 29.8%). In both years, a higher percentage of government employees had received an influenza vaccine compared with private-sector employees, who had higher percentages than the self-employed.
Source: National Health Interview Survey, 2012 and 2016. https://www.cdc.gov/nchs/nhis.htm.
Reported by: Roger R. Rosa, PhD, RRosa@cdc.gov, 202-245-0655; Abay Asfaw, PhD; Rene Pana-Cryan, PhD.


No hay comentarios:
Publicar un comentario