MMWR Weekly (No. 18)
PDF of Weekly issue
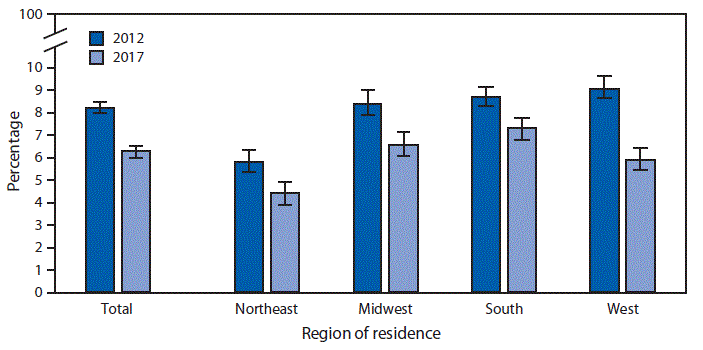
QuickStats: Age-Adjusted Percentages* of Persons of All Ages Who Delayed Seeking Medical Care in the Past 12 Months Because of Worry About Cost,† by U.S. Census Region§ of Residence — National Health Interview Survey,¶ 2012 and 2017
Weekly / May 10, 2019 / 68(18);430

* With 95% confidence intervals indicated with error bars.
† Based on a response to the question “During the past 12 months, has [person] delayed seeking medical care because of worry about the cost?” This question excluded dental care. Respondents were asked the question regarding themselves and other family members of all ages living in the same household.
§ Northeast: Connecticut, Maine, Massachusetts, New Hampshire, New Jersey, New York, Pennsylvania, Rhode Island, and Vermont; Midwest: Illinois, Indiana, Iowa, Kansas, Michigan, Minnesota, Missouri, Nebraska, North Dakota, Ohio, South Dakota, and Wisconsin; South: Alabama, Arkansas, Delaware, District of Columbia, Florida, Georgia, Kentucky, Louisiana, Maryland, Mississippi, North Carolina, Oklahoma, South Carolina, Tennessee, Texas, Virginia, and West Virginia; West: Alaska, Arizona, California, Colorado, Hawaii, Idaho, Montana, Nevada, New Mexico, Oregon, Utah, Washington, and Wyoming.
¶ Estimates are based on household interviews of a sample of the civilian, noninstitutionalized U.S. population and are derived from the National Health Interview Survey Family Core component. Estimates are age-adjusted using the projected 2000 U.S. population as the standard population and using five age groups: 0–11, 12–17, 18–44, 45–64, and ≥65 years.


.png)


No hay comentarios:
Publicar un comentario