
QuickStats: Age-Adjusted Prevalence of Total, Diagnosed, and Undiagnosed Diabetes* Among Adults Aged ≥20 Years — National Health and Nutrition Examination Survey, 1999–2000 to 2015–2016†
Weekly / October 5, 2018 / 67(39);1106
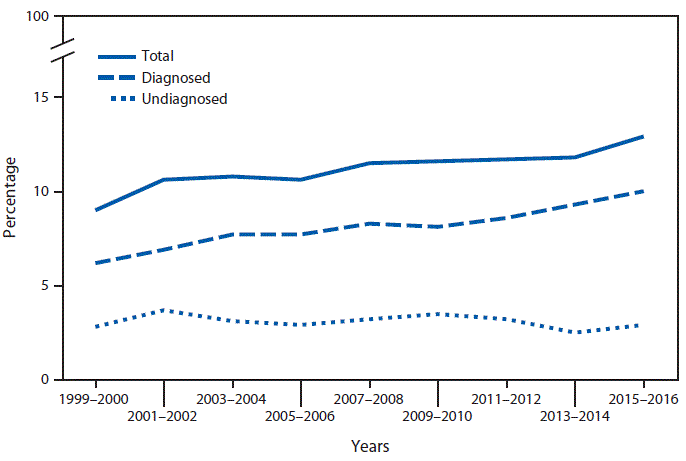
* Participants were classified as having diagnosed diabetes based on the question “Other than during pregnancy, have you ever been told by a doctor or health professional that you have diabetes or sugar diabetes?” Participants were classified as having undiagnosed diabetes if they did not report a diagnosis of diabetes by a health care provider, and their fasting (8–24 hours) plasma glucose was ≥126 mg/dL or their hemoglobin A1C was ≥6.5%. Total diabetes was the combined prevalence of diagnosed and undiagnosed diabetes.
† Current criteria from the American Diabetes Association were applied to define diabetes for all current and previous years of data. Backward calibration equations were used to adjust for changes in laboratory techniques and procedures over time. All estimates for adults are age-adjusted by the direct method to the projected 2000 U.S. Census population using age groups 20–39, 40–59, and ≥60 years.
From 1999–2000 to 2015–2016, the prevalence of total diabetes increased from 9.0% to 12.9%. The prevalence of diagnosed diabetes increased from 6.2% to 10.0%. The prevalence of undiagnosed diabetes was 2.8% in 1999–2000 and 2.9% in 2015–2016 with no significant change over this period.
Source: CDC/NCHS National Health and Nutrition Examination Survey. https://www.cdc.gov/nchs/nhanes/index.htm.
Reported by: Craig M. Hales, MD, chales@cdc.gov, 301-458-4193; Te-Ching Chen, PhD; Qiuping Gu, MD, PhD; Mark S. Eberhardt, PhD.


.png)


No hay comentarios:
Publicar un comentario