How CDC Estimates the Burden of Seasonal Influenza in the U.S.

The burden of influenza on the United States can vary widely from season to season and is determined by a number of factors including the characteristics of circulating viruses, the timing of the season, population immunity to circulating viruses, how well flu vaccines are working, and how many people have gotten vaccinated. While the impact of flu varies, it places a substantial burden on the health of people in the United States each year.
CDC uses a model to estimate the numbers of influenza illnesses, medical visits, and hospitalizations in the United States (1-4) (as well as the impact of influenza vaccination on these numbers). The methods used to calculate the estimates have been described previously (1). The same model is also extended to estimate flu-related deaths in the United States. This methodology has been used to retroactively calculate influenza burden, including deaths, going back to 2010.
This page includes information on current and past methods for estimating the number of influenza illnesses, medical visits, flu-associated hospitalizations, and flu-associated deaths that occur in the U.S. during a given season.
How CDC estimates Influenza Illness in the U.S.
What methods are used to estimate the number of influenza illnesses and medical visits in the U.S.?
The numbers of influenza illnesses were estimated from hospitalizations based on how many illnesses there are for every hospitalization, which was measured previously (5).
Some people with flu will seek medical care, while others will not. CDC estimates the number of people who sought medical care for flu using data from the 2010 Behavioral Risk Factor Surveillance Survey, which asked people whether they did or did not seek medical care for an influenza-like illness in the prior flu season (6).
How CDC estimates Influenza-Associated Hospitalizations in the U.S.
What methods are used to estimate the number of influenza-associated hospitalizations in the U.S.?
Laboratory-confirmed influenza-associated hospitalization rates are obtained from the Influenza Hospitalization Surveillance Network (FluSurv-NET), a collaboration between CDC, the Emerging Infections Program Network, and selected state and local health departments in 13 geographically distributed areas in the United States that conduct population-based surveillance. The network includes hospitals that serve roughly 9% of the U.S. population. Reported hospitalization rates are adjusted to correct for under-detection, which is calculated from the percent of persons hospitalized with respiratory illness who were tested for influenza and the average sensitivity of influenza tests used in the participating FluSurv-NET surveillance hospitals. The data to calculate these values can, in some cases, lag up to two years, so for more recent seasons, the values used are measured from data collected during prior seasons (1).
Adjusted rates are applied to the U.S. population by age group to estimate the total number of influenza-associated hospitalizations.
Top of PageHow CDC estimates Influenza-Associated Deaths in the U.S.
What methods are used to estimate the number of influenza-associated deaths in the U.S.?
The annual number of flu-associated deaths during any given season is estimated using a mathematical model, which has been described elsewhere (1). The model uses a ratio of deaths-to-hospitalizations in order to estimate the total flu-related deaths during a season.
We first look at how many in-hospital deaths were observed in FluSurv-NET. The in-hospital deaths are adjusted for under-detection, similar to the way that flu-related hospitalizations were adjusted; using data on the frequency of flu testing and the average sensitivity of available flu tests. Because not all deaths related to flu occur in the hospital, we use death certificate data to estimate how likely a death would have occurred in the hospital and, therefore, how many deaths we may not be counting because they occurred outside of the hospital. We look at death certificates that have pneumonia or influenza causes (P&I), other respiratory and circulatory causes (R&C), or other non-respiratory, non-circulatory causes of death, because deaths related to flu may not have influenza listed as a cause of death. We use information on the causes of death from FluSurv-NET to determine the mixture of P&I, R&C, and other coded deaths to include in our investigation of death certificate data. Once we estimate the proportion of flu-related deaths that occurred outside of the hospital, we can estimate the death-to-hospital ratio.
Data needed to estimate flu-related deaths may lag for up to two years. When this is not yet available for the current season, we adjust based on values observed in the most recent similar season and will update estimates when these data become available.
Why doesn’t CDC base its seasonal flu mortality estimates only on death certificates that specifically list influenza?
Seasonal influenza may lead to death from other causes, such as pneumonia, congestive heart failure, or chronic obstructive pulmonary disease. It has been recognized for many years that influenza is underreported on death certificates. There may be several reasons for underreporting, including that patients aren’t always tested for seasonal influenza infection, particularly the elderly who are at greatest risk of seasonal influenza complications and death. Even if a patient tested for influenza, influenza virus infection may not be identified because influenza virus is only detectable for a short period of time and many people don’t seek medical care until after the first few days of acute illness. Additionally, some deaths – particularly among the elderly – are associated with secondary complications of seasonal influenza (including bacterial pneumonias). For these and other reasons, modeling strategies, such as statistical or mathematical models, have been used to estimate seasonal flu-related deaths for many decades. Only counting deaths where influenza was included on a death certificate would be a gross underestimation of seasonal influenza’s true impact.
Top of PageLimitations of Influenza Burden Estimates
These estimates are subject to several limitations.
First, rates of influenza-associated hospitalizations and in-hospital death are adjusted for the frequency of influenza testing and the sensitivity of influenza diagnostic assays. However, data on testing practices are often not available at the time we estimate burden for a season. We used data on testing practices from prior seasons as a proxy, and choosing seasons that are similar with respect to overall severity and media attention that may impact influenza testing practices. Burden estimates from recent seasons will be updated at a later date when data on testing practices become available.
Second, multipliers used for estimates of influenza-associated illness and medical visits are based on data from prior seasons, which may not be accurate if patterns of care-seeking have changed.
Third, we used a mathematical model to estimate influenza-associated deaths, which relies in-hospital deaths and an adjustment for the proportion of deaths that occur outside the hospital. Information about location of death is available from death certificates. However, death certificate data from the current season are often not available at the time of estimation necessitating the use of death certification data from recent prior seasons. Furthermore, our model uses the frequency of influenza-associated deaths that have pneumonia or influenza (P&I), other respiratory or cardiovascular (other R&C), or other non-respiratory, non-cardiovascular (non-R&C) listed in the causes of death among in-hospital deaths. The exact frequencies are not available from the current season at the time of estimation, and we use information from prior seasons as a proxy until these data are available. However, analyses comparing the frequency of P&I, other R&C, and non-R&C causes of death across the 2012–2013 through 2015–2016 influenza seasons suggests that the distribution of cause of death within an age group do not vary substantially between seasons.
More information about how these estimates compare to other burden estimates and past studies can be found on CDC’s Frequently Asked Questions about Estimated Flu Burden.
Top of PageFigure 1: Illustration of Flu Burden Estimates Model
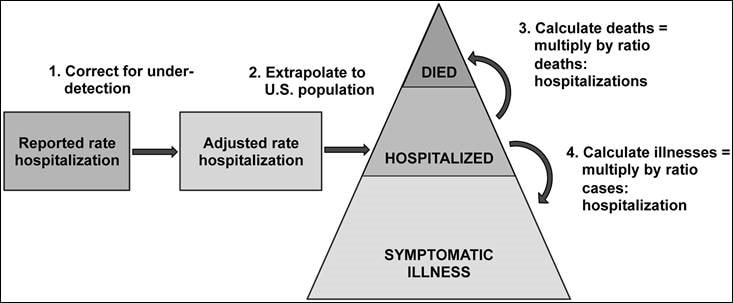
508 Text Description of Image
Starting on the left, there are two sequential boxes with arrows that lead to a pyramid. The left-most box is labelled “Reported rate of hospitalization”. There is an arrow leading right to the next box, which is labelled “Adjusted rate of hospitalization”, and over the arrow is a label “1. Correct for under-detection”. From the box, labelled “Adjusted rate of hospitalization”, is an arrow leading right to the middle of the pyramid, which is labelled “Hospitalized” and over the arrow is a label “2. Extrapolate to U.S. population”. In the pyramid, the base is labelled “Symptomatic Illness”, the middle section is labelled “Hospitalized”, and the top is labelled “Died”. On the right-side of the pyramid are arrows coming from the middle section, with one leading up to the top section, labelled “Died”, and another arrow leading down to the bottom section, labelled “Symptomatic Illness”. Next to the arrow leading up to “Died” is a label stating “3. Calculate deaths equals multiply by ratio deaths to hospitalizations”. On the arrow leading from the middle of the pyramid down to the base, which is labelled “Symptomatic Illnesses”, there is a label stating “4. Calculate illnesses equals multiply by ratio of cases to hospitalizations”.
References
- Reed C, Chaves SS, Daily Kirley P, Emerson R, Aragon D, Hancock EB, et al. Estimating influenza disease burden from population-based surveillance data in the United States. PLoS One. 2015;10(3):e0118369.
- Centers for Disease Control and Prevention. Estimated influenza illnesses and hospitalizations averted by influenza vaccination – United States, 2012-13 influenza season. MMWR Morb Mortal Wkly Rep. 2013 Dec 13;62(49):997-1000.
- Reed C, Kim IK, Singleton JA, Chaves SS, Flannery B, Finelli L, et al. Estimated influenza illnesses and hospitalizations averted by vaccination–United States, 2013-14 influenza season. MMWR Morb Mortal Wkly Rep. 2014 Dec 12;63(49):1151-4.
- Centers for Disease Control and Prevention. Estimated Influenza Illnesses and Hospitalizations Averted by Vaccination — United States, 2014–15 Influenza Season. 2015 December 10, 2015 [cited 2016 October 27];
- Centers for Disease Control and Prevention. Estimated Influenza Illnesses and Hospitalizations Averted by Vaccination — United States, 2014–15 Influenza Season. 2015 December 10, 2015 [cited 2016 October 27];
- Biggerstaff M, Jhung M, Kamimoto L, Balluz L, Finelli L. Self-reported influenza-like illness and receipt of influenza antiviral drugs during the 2009 pandemic, United States, 2009-2010. Am J Public Health. 2012 Oct;102(10):e21-6.


.png)


No hay comentarios:
Publicar un comentario