 MMWR Weekly Vol. 66, No. 21 June 02, 2017 PDF of this issue |
QuickStats: Age-Adjusted Rate* of Motor Vehicle Traffic Deaths,† by Urbanization of County of Residence§ — 2005 and 2015
Weekly / June 2, 2017 / 66(21);567
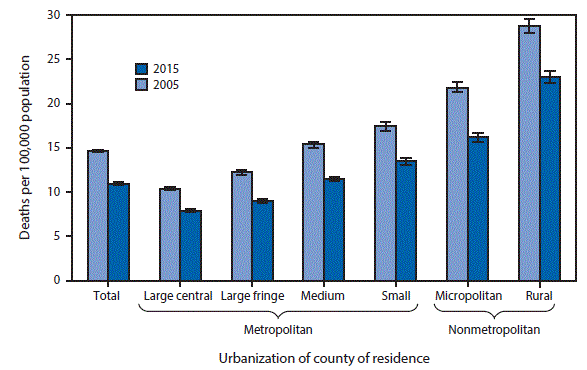
* Age-adjusted rate per 100,000, based on the 2000 U.S. standard population, with 95% confidence intervals.
† Motor vehicle traffic deaths were identified using International Classification of Diseases, Tenth Revision underlying cause of death codes V02–V04[.1,.9], V09.2, V12–V14[.3–.9], V19[.4–.6], V20–V28[.3–.9], V29–V79[.4–.9], V80[.3–.5], V81.1, V82.1, V83–V86[.0–.3], V87[.0–.8], and V89.2. All motor vehicle traffic deaths were unintentional. Motor vehicle traffic decedents included motor vehicle occupants, motorcyclists, bicyclists, and pedestrians.
§ Counties were categorized into six urbanization levels based on a classification scheme that considers metropolitan/nonmetropolitan status, population, and other factors.
The overall age-adjusted rate of motor vehicle traffic deaths in the United States decreased 25% from 14.6 deaths per 100,000 population in 2005 to 10.9 in 2015. During this period, the rate declined in each of the county groupings, with the largest decline of 26% in the large fringe metropolitan and micropolitan counties and the smallest decline of 20% in rural counties. For both years, the rates for motor vehicle traffic deaths were higher in nonmetropolitan areas than in metropolitan areas. In 2015, the age-adjusted rate in rural counties was nearly three times the rate for large central metropolitan counties (23.0 compared with 7.9 per 100,000).
Sources: National Center for Health Statistics, National Vital Statistics System, Mortality File https://www.cdc.gov/nchs/nvss/deaths.htm. Ingram DD, Franco SJ. 2013 National Center for Health Statistics urban-rural classification scheme for counties. Vital Health Stat 2014;2(166). https://www.cdc.gov/nchs/data/series/sr_02/sr02_166.pdf.
Reported by: Holly Hedegaard, MD, hdh6@cdc.gov, 301-458-4460.


.png)


No hay comentarios:
Publicar un comentario