Influenza Milestones 1917 – 2009 Timeline
Influenza Milestones (Text Version)
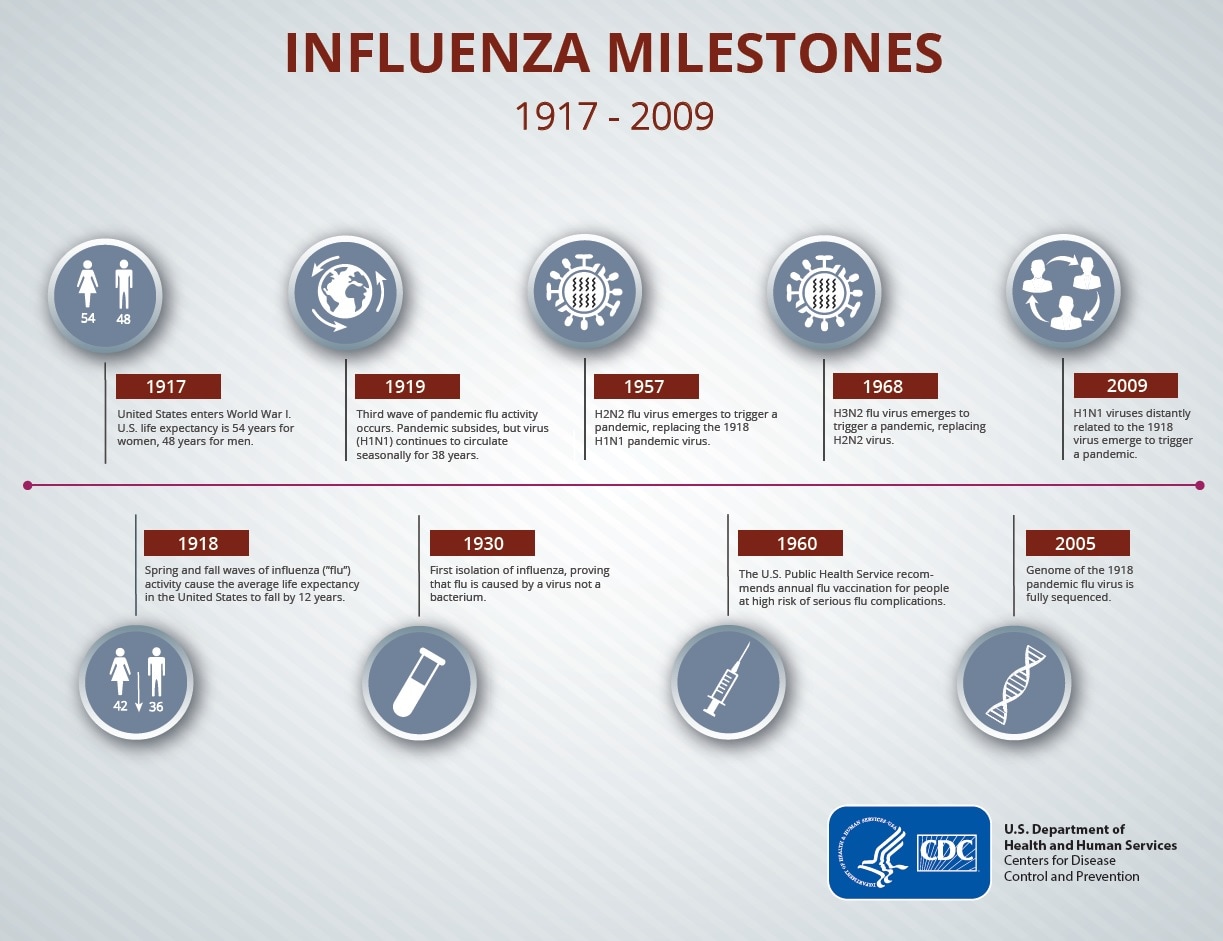
1917 – 2009
1917
[Illustration of a male and female with the number 54 under the female icon and 48 under the male icon]
United States enters World War I. U.S. life expectancy is 54 years of age for women and 48 years of age for men.
1918
[Illustration of a male and female and an arrow pointing down, with the number 42 under the female icon and 36 under the male icon]
Spring and fall waves of influenza (”flu”) activity cause the average life expectancy in the United States to fall by 12 years.
1919
[Illustration of a globe and arrows circling the globe]
Third wave of pandemic flu activity occurs. Pandemic subsides, but virus (H1N1) continues to circulate seasonally for 38 years.
1930
[Illustration of a test tube]
First isolation of influenza, proving that flu is caused by a virus not a bacterium.
1957
[Illustration of an influenza virus]
H2N2 flu virus emerges to trigger a pandemic, replacing the 1918 H1N1 pandemic virus.
1960
[Illustration of a flu vaccine syringe]
The U.S. Public Health Service recommends annual flu vaccination for people at high risk of serious flu complications.
1968
[Illustration of an influenza virus]
H3N2 flu virus emerges to trigger a pandemic, replacing H2N2 virus.
2005
[Illustration of a DNA strand]
Genome of the 1918 pandemic flu virus is fully sequenced.
2009
[Illustration of three people in a circle with arrows points from person to person]
H1N1 viruses distantly related to the 1918 virus emerge to trigger a pandemic.


.png)


No hay comentarios:
Publicar un comentario