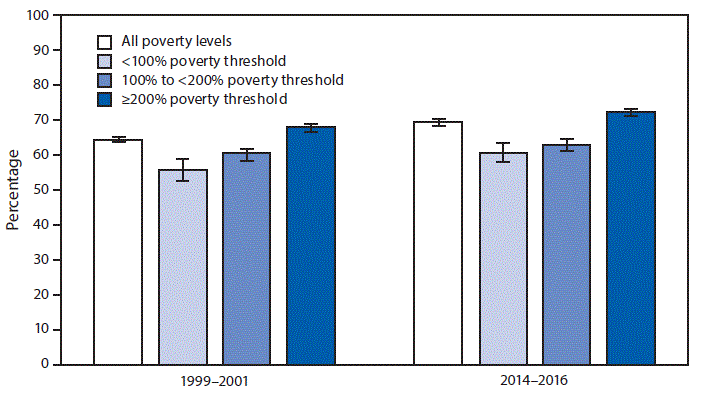
QuickStats: Age-Adjusted Percentage*,† of Adults Aged ≥65 Years Who Had an Influenza Vaccine in the Past 12 Months,§ by Poverty Status¶ — National Health Interview Survey, United States, 1999–2001 and 2014–2016
Weekly / February 23, 2018 / 67(7);233

* With 95% confidence intervals indicated by error bars.
† Estimates are based on household interviews of a sample of the noninstitutionalized U.S. civilian population and are derived from the National Health Interview Survey Sample adult component. Percentages were 3-year averages age-adjusted to the projected 2000 U.S. population as the standard population, using three age groups: 65–74, 75–84, and ≥85 years.
§ Based on the survey question,“During the past 12 months, have you had a flu vaccination?” Annual calendar- year estimates of immunizations differ from seasonal flu immunization totals, which reflect vaccinations obtained during the flu season.
¶ Poverty status is based on family income and family size using the U.S. Census Bureau poverty thresholds. Family income was imputed where missing.
During 2014–2016, 69.2% of all older adults, aged ≥65 years, had received an influenza vaccine in the past 12 months. The percentage of older adults with family income ≥200% poverty level who had received an influenza vaccine in the past 12 months significantly increased from 67.9% during 1999–2001 to 72.2% during 2014–2016. During the same period, the changes from 55.7% to 60.8% among those at the <100% poverty level and from 60.3% to 62.9% for those at the 100% to <200% poverty level were not statistically significant. During both periods, older adults with income ≥200% poverty level were significantly more likely to receive an influenza vaccine compared with those with lower family income.
Source: National Health Interview Survey, 1999–2016. https://www.cdc.gov/nchs/nhis.htm.
Reported by: Julie D. Weeks, PhD, JWeeks@cdc.gov, 301-458-4562; Yelena Gorina.


.png)


No hay comentarios:
Publicar un comentario