 |
| MMWR Weekly Vol. 65, No. 48 December 09, 2016 |
| PDF of this issue |
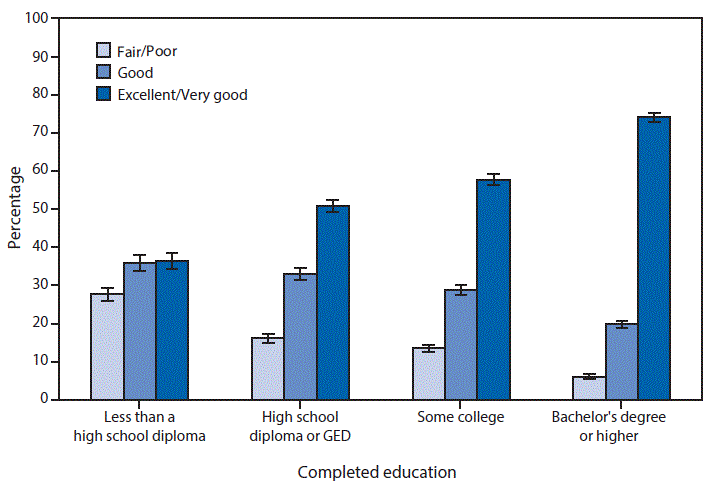
QuickStats: Percentage Distribution* of Respondent-Assessed Health Status† Among Adults Aged ≥25 Years, by Completed Education — National Health Interview Survey,§ United States, 2015
Weekly / December 9, 2016 / 65(48);1383

Abbreviation: GED = General Educational Development high school equivalency diploma.
* With 95% confidence intervals indicated with error bars.
† Based on a survey question that asked respondents, “Would you say [subject name’s] health in general was excellent, very good, good, fair, or poor?” This information was obtained during a part of the interview that allowed proxy responses, such that a knowledgeable adult family member could respond on behalf of sample adults not taking part in this interview. “Excellent” and “very good” are combined as are “fair” and “poor.”
§ Estimates are based on household interviews of a sample of the civilian, noninstitutionalized U.S. population, are shown for sample adults aged ≥25 years, and are age-adjusted to the projected 2000 U.S. population as the standard population using four age groups: 25–44, 45–64, 65–74, and ≥75 years.
In 2015, health status improved as the level of education increased; 74% of adults with a bachelor’s degree or higher were in excellent or very good health compared with almost 37% of adults with less than a high school diploma. Nearly 28% of adults with less than a high school diploma were in fair or poor health compared with 6% of adults with a bachelor’s degree or higher.
Source: Blackwell DL, Villarroel MA. Tables of summary health statistics for U.S. adults: 2015 National Health Interview Survey. National Center for Health Statistics 2016. http://www.cdc.gov/nchs/nhis/SHS/tables.htm.
Source: Blackwell DL, Villarroel MA. Tables of summary health statistics for U.S. adults: 2015 National Health Interview Survey. National Center for Health Statistics 2016. http://www.cdc.gov/nchs/nhis/SHS/tables.htm.
Reported by: Debra L. Blackwell, PhD, DBlackwell@cdc.gov, 301-458-4103; Maria A. Villarroel, PhD.


.jpg)


No hay comentarios:
Publicar un comentario