Volume 26, Number 6—June 2020
Research
Temporary Fertility Decline after Large Rubella Outbreak, Japan
On This Page
Tables
Article Metrics
Kenji Mizumoto and Gerardo Chowell
Abstract
Japan experienced 2 large rubella epidemics in 2004 and 2012–2014. Because of suboptimal immunization levels, the country has been experiencing a third major outbreak during 2018–2020. We conducted time series analyses to evaluate the effect of the 2012–2014 nationwide rubella epidemic on prefecture-level natality in Japan. We identified a statistically significant decline in fertility rates associated with rubella epidemic activity and increased Google searches for the term “rubella.” We noted that the timing of fertility declines in 2014 occurred 9–13 months after peak rubella incidence months in 2013 in 4 prefectures with the highest rubella incidence. Public health interventions should focus on enhancing vaccination campaigns against rubella, not only to protect pregnant women from infection but also to mitigate declines in population size and birth rates.
Japan has recently experienced 2 large rubella epidemics. A 2004 epidemic had 4,248 reported cases, and another outbreak during 2012–2014 had 12,614 reported rubella cases and 45 reported cases of severe birth defects in newborns (1–4). Because of suboptimal immunization levels, Japan is now experiencing a third major rubella outbreak that began in 2018 (5–7). This epidemic has resulted in 5,296 reported cases as of April 12, 2020, and has affected all 47 prefectures by the 13th week of 2020 (8).
Rubella infections during early pregnancy can lead to serious health consequences, including miscarriages, stillbirths, and severe birth defects in newborns, known as congenital rubella syndrome (CRS) (9). The continued rubella epidemic in Japan led the US Centers for Disease Control and Prevention to issue a travel alert on October 22, 2018, that urged increased precautions and recommended pregnant women not protected against rubella avoid traveling to Japan (9).
Past studies have suggested that the 1918–1920 influenza pandemic had a profound effect on those planning to conceive children, which led to declines in birth rates after adjusting for maternal death (10,11). We examined the effects of Japan’s large rubella outbreak during 2012–2014 on behavioral changes among women of childbearing age by quantifying the temporal changes in fertility rates and rubella cases in 4 prefectures of Japan that experienced the brunt of the 2013 rubella epidemic.
Data Sources
We extracted data on births/month and estimated female population/year stratified by age and prefecture from January 1, 2013–December 31, 2017, for Japan and 4 prefectures with the highest cumulative number of rubella cases in 2013 from the Ministry of Internal Affairs and Communications in Japan (12). Then, we calculated monthly estimates of the female population 15–49 years of age during 2013–2018 by using a smoothing cubic spline interpolation-fitting method with a knot at each data point. Because the number of births/age group was not available, we considered the fertility rate to be the proportion of births divided by the number of female persons 15–49 years of age/1,000 population/year.
We collected notifications of rubella and CRS cases from weekly reports published by the National Institute of Infectious Diseases in Japan and converted these to monthly case counts (8). Surveillance relies on mandatory notifications and medical institutions must report all diagnosed rubella and CRS cases. Clinical diagnosis of rubella includes symptoms of generalized rash, swollen lymph nodes, and fever.
We also extracted relevant monthly data on Google search terms from Google Trends () to quantify the public attention to the rubella epidemic. We suspect anxiety was driven by a perceived risk rather than actual risk. For example, during a 2014–15 outbreak of Ebola virus, the public conducted internet searches to collect information related to the epidemic, even in areas with extremely low risk for infection (13). Google Trends uses searches for keywords and search terms to provide data on search volume in a geographic region over time and generates an output scale of 0–100 (14).
We conducted a search of Google Trends by using the search topic strategy for January 1, 2012–December 31, 2017, and included the Tokyo, Kanagawa, Osaka, and Hyogo prefectures by using the Japanese word for rubella, “fushin.” We used data from years after 2013 to exclude demographic changes and perinatal outcomes associated with the Great East Japan Earthquake that occurred on March 11, 2011 (15).
Statistical Analysis
Time series data can be decomposed into three components: seasonality, long-term trends, and random (16,17). For our study, the seasonal and trend components contain effects of long-term changes. Temporal variation in the fertility rate over time can be effected by systematic seasonal changes, such as the number of marriages, and long-term trends, such as population demography. By filtering out these components, we were able to concentrate on a single event. We applied moving averages to extract monthly seasonal- and trend-adjusted elevated fertility rates and their residuals. To detect temporal associations between these time series data, we examined cross-coefficients of fertility rates, rubella cases, and Google searches for “rubella” at different lag intervals (lags or leads <12 months) for each combination of 2/3 variables. A more detailed description of this procedure is published elsewhere (10,18,19). Then, we used an augmented Dickey-Fuller test for stationarity analysis. We used the Mann-Kendall test for trend analysis and null hypotheses of 0 cross-correlation for each of the estimated correlation coefficients.
We used a bootstrap method with 1,000 replications to calculate mean monthly and annual fertility rates in 2014 and corresponding confidence intervals. We performed statistical analyses in R version 3.2.3 (R Foundation for Statistical Computing, ).

Figure 1. Spatial and temporal variations of rubella and CRS in Japan, 2013–2019. A) Geospatial variation in cumulative rubella cases by prefecture, 2013. B) Temporal distribution of rubella and CRS cases by month...
We assessed geospatial variation in cumulative rubella cases across Japan in 2013 (Figure 1, panel A). The highest rubella incidence occurred in Tokyo (2,547 cases), Osaka (2,241 cases), Kanagawa (1,230 cases), and Hyogo (941 cases). The distribution of cumulative rubella cases across all prefectures was highly skewed to the right with a median of 44.0 (interquartile range 20.5–106.5). We assessed the number of rubella and CRS cases by month during 2013–2019. During the 2012–2014 outbreak, the highest incidence of rubella was 2,513 cases in May 2013 and the highest incidence of CRS was 7 cases in October 2013 (Figure 1, panel B).
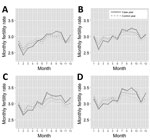
Figure 2. Temporal variation of fertility rates by prefecture in Japan, 2013–2017. A) Tokyo; B) Kanagawa; C) Osaka; and D) Hyogo. Solid line indicates average fertility rate during the case year, 2014. Dashed...
We assessed the seasonal variation of fertility rates for the 4 prefectures with the highest rubella burden (Figure 2). We observed fertility rate declines for 2014 during 5 months in Tokyo, 2 months in Kanagawa, 3 months in Osaka, and 4 months in Hyogo, after which rates increased during 6 months in Tokyo, 5 months in Kanagawa, 2 months in Osaka, and 4 months in Hyogo. Of note, fertility rate declines in 2014 occurred in the first half of the year, which corresponds to 9–13 months after rubella incidence peaked in Tokyo, 11–12 months after peak incidence in Kanagawa, 9–11 months after peak incidence in Osaka, and 8–12 months after peak incidence in Hyogo (Table). We believe behavioral changes occurred around the peak rubella incidences and calculated times after the peak incidence of rubella cases.
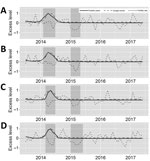
Figure 3. Cross-correlation between rubella cases, Google searches for “rubella,” and elevated fertility rates, Tokyo, Japan, 2012–2016. Cross-correlation coefficients were calculated in each lag, –12 months, lead period, +12 months, and at 0....
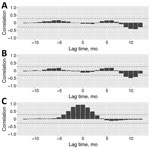
Figure 4. Temporal distribution of rubella cases, Google searches for the term “rubella,” and elevated fertility rates by prefecture, 2013–2017, Japan. A) Tokyo; B) Kanagawa; C) Osaka; D) Hyogo Time-series of rubella cases,...
We plotted the time series of rubella cases, Google searches for “rubella,” and seasonality- and trend-adjusted fertility rates for the 4 prefectures with the highest rubella incidence (Figure 3). We found that peaks in rubella cases and Google searches for “rubella” were synchronized across the 4 prefectures with the most rubella cases. However, troughs in elevated fertility rates occurred 9–11 months after the peak in rubella cases and Google searches for “rubella” (Table). To statistically assess the timescale of the association between rubella cases, Google searches for “rubella,” and elevated fertility rates, we calculated cross-correlations between these 3 signals in the time series. In Tokyo, we found a negative association between rubella incidence and fertility rates at a time lag of 9 months (r = –0.280), 10 months (r = –0.390), 11 months (r = –0.408), and 12 months (r = –0.284) and between Google searches for “rubella” and fertility rates at time lags of 9 months (r = –0.382), 10 months (r = –0.468), and 11 months (r = –0.397) (Figure 4; Appendix Table 1). We also identified negative associations between rubella incidence and fertility rates in Kanagawa at time lags of 9 months (r = –0.320), 10 months (r = –0.428), and 11 months (r = –0.446) and between Google searches for “rubella” and fertility rates at time lags of 9 months (r = –0.385), 10 months (r = –0.461), and 11 months (r = –0.432) (Appendix Table 2, Figure 1). In Osaka, we found positive and negative associations between rubella cases and fertility rates at a time lag of 5 months (r = 0.296), 9 months (r = –0.365), 10 months (r = –0.424), and 11 months (r = –0.319) and between Google searches for “rubella” and fertility rates at 4 months (r = 0.286), 5 months (r = 0.316), 9 months (r = –0.356), 10 months (r = –0.437), and 11 months (r = –0.361) (Appendix Table 3, Figure 2). In Hyogo, we identified positive and negative associations between rubella cases and fertility rates at a time lag of 5 months (r = 0.347), 9 months (r = –0.309), 10 months (r = –0.410), and 11 months (r = –0.402) and between Google searches for “rubella” and fertility rates at 0 months (r = –0.298), 5 months (r = 0.346), 9 months (r = –0.310), 10 months (r = –0.398), and 11 months (r = –0.393) (Appendix Table 4, Figure 3). We observed several positive associations between rubella incidence and Google searches for “rubella” in all 4 prefectures.
We decomposed time series data of fertility rates for Tokyo, Kanagawa, Osaka, and Hyogo (Appendix Figure 4). We observed downward trends in fertility rates but a small peak during 2015 and an upward trend before 2015 in Tokyo. Seasonally, fertility rates tend to decrease in the first half of the year and increase in the second half of the year.
We did not find statistically significant differences in fertility rates between 2014 and the control years. Fertility rate differences between 2014 and control years were 34.87 (95% CI 34.01–35.20)/1,000 women of childbearing age in Tokyo, 36.52 (95% CI 35.06–36.92)/1,000 women of childbearing age in Kanagawa, 35.95 (95% CI 35.25–36.6)/1,000 women of childbearing age in Osaka, and 37.97 (95% CI 37.15–38.53)/1,000 women of childbearing age in Hyogo.
We assessed the effect of the 2012–2014 rubella epidemic on prefecture-level natality in Japan. We identified a statistically significant decline in fertility rates associated with rubella epidemic activity and Google searches for “rubella.” We noted declines in fertility rates in 2014 that occurred after each peak month of rubella case incidence in 2013, which was 9–13 months after peaks in Tokyo, 11–12 months in Kanagawa, 9–11 months in Osaka, and 8–12 months in Hyogo. Considering the relatively small number of rubella cases during 2012–2014, we do not think the reduction in fertility was caused by miscarriages or stillbirths but by voluntary pregnancy delays because of perceived risk for CRS, which is reflected in increases in Google searches for “rubella.”
Birth rate declines associated with infectious disease epidemics could exacerbate the effects of demographic changes in Japan, which are characterized by decreased population, declines in birth rates, and a delayed childbearing trend. According to the 2010 census, the population of Japan is ≈127.09 million, a decrease of 962,607 from the previous census (20). In addition, the fertility rate was 1.44/1,000 female persons 15–49 years of age in 2016, much lower than the replacement-level fertility of 2.1/1,000, the minimum level needed to sustain population size (21). Similarly, the average age of women at first childbirth rose from 25.6 years of age in 1970 to 30.7 years of age in 2016. Older maternal age is associated with increased risks for adverse pregnancy and birth outcomes (22–26).
We found no statistically significant differences in birth rates between 2014 and the control years (2013, 2015, 2016, and 2017). However, pregnancy delays related to fear of infection and the increased proportion of late-age childbearing exacerbate the declining birth trend for the ongoing and future rubella epidemics. Therefore, Japan’s government should implement public health interventions to rapidly curtail rubella transmission, protect childbearing mothers, and sustain birth rates.
Our study has several limitations. First, we did not establish a causal relationship between an increase of rubella cases and a decrease of fertility rate, but studies have suggested a person’s behavior will change not only because of actual risk but also because of perceived risk (13). Indeed, some segments of the population with low vaccination coverage in Japan, such as women 24–34 years of age who are part of a relatively small group of persons born during 1989–1993 in which only 78.3% are seropositive, presumably worry about infection and CRS (1,6). In addition, soon after the rubella outbreak occurred, the Ministry of Health, Labour and Welfare issued its first notice to alert the public on May 25, 2012, and subsequently issued an additional 7 notices during the outbreak (27). On January 29, 2013, Japan’s National Institute of Infectious Diseases published specific guidelines for prevention and control of rubella and CRS (28). These approaches likely increased the population’s awareness about the risk for rubella infection and its potential consequences. Furthermore, a substantial number of pregnancies likely were delayed until the end of the outbreaks because of concerns about rubella infection, and public awareness, which is partially supported by the internet search activities recorded by Google Trends. In addition, the relationship between the 1918 influenza pandemic and fertility, in which a direct causal relationship was estimated (10,18,19), indicates a remarkable decline in births occurring 9–11 months after the surge in pandemic mortality rates. A similar phenomenon was observed for the Zika virus (ZIKV) epidemic. After the identification of the probable association between ZIKV infection during pregnancy and microcephaly in 2016 (29–31), public concern over ZIKV quickly increased in Brazil, where a substantial number of microcephaly cases initially were reported. As a result, birth rates in Brazil’s largest cities during the second half of 2016 exhibited substantial reductions ≈9 months after the start of media coverage for the ZIKV epidemic (32,33). We found a similar fertility decline 9–11 months after the peaks in rubella case incidence and peak Google searches for “rubella” across all 4 prefectures. To reinforce the statistical association, we conducted additional analyses. We used influenza, which does not affect people’s fertility decisions, as a control and did not find a decline in fertility associated with influenza case counts or the Google searches for “influenza” (Appendix Tables 5–8, Figures 5–8). We explored wavelet cross-correlation to measure similarity between 2 signals at different scales (34,35). We identified relatively high coefficients at a lag time of 9–11 months in levels 2 and 3 between rubella incidence and fertility, and between rubella incidence and Google searches for “rubella,” consistent with our results (Appendix Tables 9–11, Figures 9–20).
Second, we did not identify the causal relationship for the substantial fertility rate increases ahead of substantial fertility rate declines. Although we examined the association between fertility rates and other factors, including economic index, such as prefectural-level unemployment rates and the Nikkei Index, and the number of marriages (data not shown), we did not identify statistically significant associations. Several interrelated factors likely played a role. In addition, we only observed the lagged increases in Osaka and Hyogo, and the number of the months and the correlation coefficients are relatively small compared with the lagged decrease.
Third, an increase in Google searches for “rubella” might have preceded an outbreak of rubella cases at the prefectural level because media reporting about the outbreaks raised public awareness, potentially leading to large-scale behavior changes in the country. However, the temporal variations of rubella cases and Google searches for “rubella” in all 4 prefectures are highly correlated at a time lag of 0 (Figure 4; Appendix Tables 1–4, Figures 1–3) and rubella case incidence and Google searches for “rubella” mostly were synchronized.
In conclusion, our analyses indicate a substantial temporal decline in the fertility rate in Japan after a major rubella outbreak in 2012–2014. Public health interventions should focus on enhancing vaccination campaigns against rubella, not only to protect pregnant women from infection but also to mitigate declines in population size and birth rates.
Dr. Mizumoto works as an assistant professor at the Graduate School of Advanced Integrated Studies in Human Survivability, Kyoto University in Japan. His research interests include mathematical and statistical epidemiology and modeling of infectious diseases. Dr. Chowell is a professor of epidemiology and biostatistics and chair of the Department of Population Health Sciences at the Georgia State University School of Public Health. He is also a senior research fellow at the Fogarty International Center, National Institutes of Health, USA. His research interests include mathematical modeling of infectious disease dynamics and control.
Acknowledgment
K.M. received support from the Japan Society for the Promotion of Science KAKENHI (grant no. 15K20936), from the Program for Advancing Strategic International Networks to Accelerate the Circulation of Talented Researchers (grant no. G2801), and from the Leading Initiative for Excellent Young Researchers from the Ministry of Education, Culture, Sport, Science & Technology of Japan. G.C. received support from the National Science Foundation (grant no. 1414374) as part of the joint National Science Foundation, National Institutes of Health, and US Department of Agriculture Ecology and Evolution of Infectious Diseases program and a grant from the UK Biotechnology and Biological Sciences Research Council (no. BB/M008894/1).
References
- Ujiie M, Nabae K, Shobayashi T. Rubella outbreak in Japan. Lancet. 2014;383:1460–1.
- Minakami H, Kubo T, Unno N. Causes of a nationwide rubella outbreak in Japan, 2012-2013. J Infect. 2014;68:99–101.
- Centers for Disease Control and Prevention (CDC). Nationwide rubella epidemic—Japan, 2013. MMWR Morb Mortal Wkly Rep. 2013;62:457–62.
- Sugishita Y, Shimatani N, Katow S, Takahashi T, Hori N. Epidemiological characteristics of rubella and congenital rubella syndrome in the 2012-2013 epidemics in Tokyo, Japan. Jpn J Infect Dis. 2015;68:159–65.
- Saito MM, Ejima K, Kinoshita R, Nishiura H. Assessing the effectiveness and cost-benefit of test-and-vaccinate policy for supplementary vaccination against rubella with limited doses. Int J Environ Res Public Health. 2018;15:
E572 . - Kinoshita R, Nishiura H. Assessing herd immunity against rubella in Japan: a retrospective seroepidemiological analysis of age-dependent transmission dynamics. BMJ Open. 2016;6:
e009928 . - Nishiura H, Kinoshita R, Miyamatsu Y, Mizumoto K. Investigating the immunizing effect of the rubella epidemic in Japan, 2012-14. Int J Infect Dis. 2015;38:16–8.
- Infectious Disease Surveillance Center, National Institute of Infectious Diseases, Japan. Infectious Diseases Weekly Report [in Japanese] [cited 2020 April 12].
- US Centers for Disease Control and Prevention. Rubella in Japan [cited 2018 Oct 24]
- Chandra S, Christensen J, Mamelund SE, Paneth N. Short-term birth sequelae of the 1918–20 influenza pandemic in the United States: state-level analysis. Am J Epidemiol. 2018;187:2585–95.
- Bureau of the Census. Birth statistics for the registration area of the United States 1921. Washington, DC: Government Printing Office; 1923 [cited 2018 Nov 2].
- Ministry of Internal Affairs and Communications. Statistics Japan [in Japanese] [cited 2018 Oct 24].
- Fung IC-H, Tse ZT, Cheung CN, Miu AS, Fu KW. Ebola and the social media. Lancet. 2014;384:2207.
- Gianfredi V, Bragazzi NL, Mahamid M, Bisharat B, Mahroum N, Amital H, et al. Monitoring public interest toward pertussis outbreaks: an extensive Google Trends-based analysis. Public Health. 2018;165:9–15.
- Suzuki K, Yamagata Z, Kawado M, Hashimoto S. Effects of the great East Japan Earthquake on secondary sex ratio and perinatal outcomes. J Epidemiol. 2016;26:76–83.
- Brockwell PJ, Davis RA. Introduction to time series and forecasting, second edition. New York: Springer Verlag; 2002.
- Kendall M, Stuart A, Ord JK. The advanced theory of statistics, vol. 3, 4th ed. High Wycombe (England): Charles Griffin; 1983.
- Dahal S, Mizumoto K, Bolin B, Viboud C, Chowell G. Natality decline and spatial variation in excess death rates during the 1918–1920 influenza pandemic in Arizona, United States. Am J Epidemiol. 2018;187:2577–84.
- Chandra S, Yu Y-L. Fertility decline and the 1918 influenza pandemic in Taiwan. Biodemogr Soc Biol. 2015;61:266–72.
- Statistics Bureau, Ministry of Internal Affairs and Communications Japan. Statistical handbook of Japan 2017 [cited 2018 Oct 24].
- World Health Organization South-East Asia. Total fertility rate, health situation and trend assessment [cited 2020 April 12].
- Kato T, Yorifuji T, Yamakawa M, Inoue S, Doi H, Eboshida A, et al. Association of maternal age with child health: A Japanese longitudinal study. PLoS One. 2017;12:
e0172544 . - Heffner LJ. Advanced maternal age—how old is too old? N Engl J Med. 2004;351:1927–9.
- Schmidt L, Sobotka T, Bentzen JG, Nyboe Andersen A; ESHRE Reproduction and Society Task Force. Demographic and medical consequences of the postponement of parenthood. Hum Reprod Update. 2012;18:29–43.
- Carolan M, Frankowska D. Advanced maternal age and adverse perinatal outcome: a review of the evidence. Midwifery. 2011;27:793–801.
- Hsieh TT, Liou JD, Hsu JJ, Lo LM, Chen SF, Hung TH. Advanced maternal age and adverse perinatal outcomes in an Asian population. Eur J Obstet Gynecol Reprod Biol. 2010;148:21–6.
- National Institute of Infectious Diseases. Risk assessment for rubella outbreak and congenital rubella syndrome [in Japanese]. 2013 Sep 30 [cited 2018 Oct 24].
- National Institute of Infectious Diseases. Guidance on strengthening measures for prevention and control of rubella and congenital rubella syndrome [in Japanese]. Infectious Agents Surveillance Report. 2013:34;90 [cited 2018 Oct 24]
- Schuler-Faccini L, Ribeiro EM, Feitosa IM, Horovitz DD, Cavalcanti DP, Pessoa A, et al.; Brazilian Medical Genetics Society–Zika Embryopathy Task Force. Possible association between Zika virus infection and microcephaly—Brazil, 2015. MMWR Morb Mortal Wkly Rep. 2016;65:59–62.
- Johansson MA, Mier-y-Teran-Romero L, Reefhuis J, Gilboa SM, Hills SL. Zika and the risk of microcephaly. N Engl J Med. 2016;375:1–4.
- Nishiura H, Mizumoto K, Rock KS, Yasuda Y, Kinoshita R, Miyamatsu Y. A theoretical estimate of the risk of microcephaly during pregnancy with Zika virus infection. Epidemics. 2016;15:66–70.
- Diaz-Quijano FA, Chiavegatto Filho ADP. Reduction of the birth rate in São Paulo: a probable effect of the panic caused by the Zika-associated microcephaly epidemic. Ann Epidemiol. 2017;27:616–7.
- Diaz-Quijano FA, Pelissari DM, Chiavegatto Filho ADP. Zika-associated microcephaly epidemic and birth rate reduction in Brazilian cities. Am J Public Health. 2018;108:514–6.
- Cazelles B, Chavez M, Berteaux D, Ménard F, Vik JO, Jenouvrier S, et al. Wavelet analysis of ecological time series. Oecologia. 2008;156:287–304.
- Metcalf CJE, Walter KS, Wesolowski A, Buckee CO, Shevliakova E, Tatem AJ, et al. Identifying climate drivers of infectious disease dynamics: recent advances and challenges ahead. Proc Biol Sci. 2017;284:
20170901 .
Figures
Table
Cite This ArticleOriginal Publication Date: April 24, 2020


.png)


No hay comentarios:
Publicar un comentario