
Volume 26, Number 3—March 2020
Dispatch
Avian Influenza Virus Detection Rates in Poultry and Environment at Live Poultry Markets, Guangdong, China
On This Page
Article Metrics
Kit Ling Cheng1, Jie Wu1, Wei Ling Shen, Alvina Y.L. Wong, Qianfang Guo, Jianxiang Yu, Xue Zhuang, Wen Su, Tie Song, Malik Peiris, Hui-Ling Yen2 , and Eric H.Y. Lau2
Abstract
We report the use of environmental samples to assess avian influenza virus activity in chickens at live poultry markets in China. Results of environmental and chicken samples correlate moderately well. However, collection of multiple environmental samples from holding, processing, and selling areas is recommended to detect viruses expected to have low prevalence.
Live poultry markets (LPMs) can serve as hubs for avian influenza virus (AIV) amplification in poultry and pose a risk for human zoonotic infections (1–4). Adopting efficient sampling strategies to monitor AIVs with human zoonotic potential at LPMs is essential for zoonotic disease prevention and pandemic preparedness. Recommendations regarding routine surveillance that would robustly and efficiently inform AIV activity at LPMs have been limited (5).
Handling of live poultry interrupts the vending process; moreover, such routine surveillance is difficult to implement. Environmental samples have been collected to monitor AIV activity at LPMs (5–9). There have been limited parallel comparisons of AIV detection rates among poultry and environmental samples (7,10). Without frequent cleaning, the environment often permits AIV accumulation; environmental samples may thus overestimate AIV prevalence in poultry. Subtype-specific detection rates among different environmental samples may also vary. To inform the development of effective sampling strategies for AIV surveillance, we compared monthly detection rates for AIV subtypes H5, H7, and H9 in chickens and various environmental samples at LPMs in Guangzhou, China.
During December 2015–July 2018, we performed sampling twice per month at 1 wholesale (52 stalls) and 1 retail (8 stalls) LPM, from 2 randomly selected stalls per sampling event. We collected paired oropharyngeal and cloacal swab samples (n = 3,119 chickens) and environmental samples (n = 3,008) in viral transport medium at the LPMs (Appendix Figure 1). We randomly collected samples from all chickens at the selected stalls. We rarely observed sick chickens but we sampled them when identified. We also collected environmental samples from 3 key activity areas: poultry holding zones (fecal droppings, drinking water, and poultry feed), slaughtering zones (defeathering machines and surrounding defeathering working areas), and selling zones (chopping boards and display tables) near the selected chickens whenever possible (5–9). (Stalls sampled at the wholesale LPM [wLPM] have only poultry holding zones.) We sampled air using BC-251 cyclone-based NIOSH bioaerosol samplers that fractionate airborne particles into >4 μm, 1–4 μm, and <1 μm size fractions (11). We applied quantitative real-time reverse transcription PCR to detect the matrix gene segment of AIV; we analyzed positive samples by the hemagglutinin gene to determine the AIV subtype (H5, H7, or H9) using specific primers and probes (12,13).
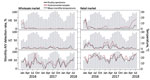
Figure 1. Monthly AIV H5, H7, and H9 positivity rates detected in poultry and environmental samples at live poultry markets (LPMs), Guangdong, China, December 2015–July 2018. Chicken (oropharyngeal and cloacal swab specimens) and...
H5, H7, and H9 detection rates in environmental samples (median monthly difference 6.2% for H5, 3.1% for H7, and 34.1% for H9; all p<0.02 by Mann-Whitney test) were much higher at the retail LPM (rLPM) than that at the wLPM (Figure 1), probably because of poultry mixing, aggregation, and extended stay at retail settings. Human H5 or H7 zoonotic infections clustered in winter, but we observed no correlation (p>0.215 for both) between temperature (14) and H5 or H7 detection rates in chickens or environmental samples at both markets. We did not assess other confounding factors, including market interventions and poultry holding duration.
We evaluated correlations between monthly AIV detection rates in chickens and environmental samples (moderate correlation for rs>0.5, at which point environmental samples are considered useful to monitor AIV in chickens). We observed a positive correlation for H5 (Spearman rs = 0.569, p<0.001) and H9 viruses (rs = 0.702, p<0.001) at the wLPM and for H5 (rs = 0.581, p<0.001), H7 (rs = 0.760, p<0.001), and H9 viruses (rs = 0.685, p<0.001) at the rLPM. We examined the use of environmental samples to assess AIV activity in poultry (Table 1). Environmental samples collected at the rLPM provided higher sensitivity in detecting H5, H7, or H9 viruses in poultry than those from the wLPM. Environmental samples were less likely to detect H5 and H7 viruses in poultry at the wLPM than at the rLPM (Appendix Tables 1, 2), possibly because of the low prevalence of infection in birds, a higher poultry turnover rate, and comparatively thorough daily cleaning practices at the wLPM. The lower specificity for H5 at the rLPM may be the result of carryover contamination at the poultry slaughtering area caused by processing birds of other species. The probabilities of accurately detecting the presence or absence of H5, H7, and H9 subtypes in poultry from environmental samples were comparable for the wLPM (68.8%–93.8%) and the rLPM (59.4%–100%) (Table 1). This finding suggests that environmental samples provided a useful indication of AIV activity in chickens at LPMs. Nevertheless, for H5 and H7 viruses at the wLPM, in only 1 month did all environment samples test positive when bird samples were also positive, demonstrating the need to take a wide range of environment samples.
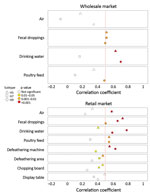
Figure 2. Correlation between AIV detection rates in poultry and environmental samples at live poultry markets (LPMs), Guangdong, China, December 2015–July 2018. Monthly AIV, H5, H7, and H9 detection rates in chicken and...
We investigated correlations between specific environmental samples and monthly H5, H7, and H9 detection rates in chickens (Figure 2; Appendix Figure 2). At the wLPM, positive rates for H5 (rs = 0.515, p = 0.003), H7 (rs = 0.514, p = 0.003), and H9 (rs = 0.508, p = 0.003) in fecal droppings correlated moderately well with viral prevalence in chickens, whereas drinking water provided the best correlation for H5 (rs = 0.633, p<0.001) and H9 (rs = 0.702, p<0.001) (Figure 2) and was more sensitive for H9 (Appendix Figure 3). At the rLPM, H9 detection rates in drinking water (rs = 0.593, p<0.001), poultry feed (rs = 0.550, p = 0.002), and fecal droppings (rs = 0.506, p = 0.003) best correlated with H9 prevalence in chickens; drinking water was most sensitive (Appendix Figure 3). H7 detection rates in drinking water (rs = 0.784, p<0.001), fecal droppings (rs = 0.663, p<0.001), defeathering machines (rs = 0.634, p<0.001), and air (rs = 0.585, p<0.001) best correlated with H7 prevalence in chickens. The H5 detection rates in fecal droppings (rs = 0.729, p<0.001), defeathering machines (rs = 0.556, p<0.001), and poultry feed (rs = 0.550, p = 0.02) best correlated with H5 prevalence in chickens. Collectively, these results suggest that fecal droppings may provide a good estimation for H5, H7, and H9 prevalence in chickens at LPMs and that drinking water can be more sensitive in some settings and useful for determining virus contamination in LPMs. For viruses present at low prevalence (e.g., H5), low sensitivity is expected.
We summarized H5, H7, and H9 detection rates in various environmental samples at the rLPM (Table 2). H5 virus was most frequently detected from poultry selling zones (median monthly positive rate 27.9%, 95% CI 0%–50%), especially from chopping boards (33%, 95% CI 0%–50%), whereas H7 virus was most frequently detected from poultry slaughtering zones (6.1%, 95% CI 0%–22.2%), especially from defeathering machines. H9 virus was frequently detected from all sampling sites. However, we found no clear difference in environmental sites for detecting H5, H7, or H9 (Appendix Tables 1, 2).
AIV detection rates in environmental samples correlated moderately with AIV activity in chickens at LPMs. Environmental sampling at rLPMs provides greater sensitivity in detecting H5, H7, and H9 AIV in poultry than that at the wLPMs and should be included as routine surveillance to monitor AIV activity. At the rLPM, H5 and H7 viruses were most frequently detected from poultry selling and poultry slaughtering areas, whereas the highly prevalent H9 viruses were detected frequently at poultry holding, slaughtering, and selling areas. Environmental samples with the highest detection rate for H5, H7, and H9 viruses may not provide the best indication of virus activity in poultry, however. Some market stalls containing viruses with low prevalence would be misclassified if only environmental or bird samples were collected. To detect viruses expected to be present at low prevalence, environmental samples should be collected from multiple sites in each market stall, including samples from holding, processing, and selling areas.
Ms. Cheng is a postgraduate student at the University of Hong Kong. Her primary research interest is avian influenza epidemiology at live poultry markets. Dr. Wu is the chief technician for respiratory pathogens at Guangdong Provincial Center for Disease Control and Prevention, Guangdong, China. Her research interest is in monitoring human infection risk by avian influenza viruses at the human–poultry interface.
Acknowledgment
This study was supported by contract HHSN272201400006C from the United States Department of Health and Human Services and the Theme-based Research Scheme (project no. T11-705/14N) from the Research Grants Council, Hong Kong SAR, China.
References
- Peiris JS, Cowling BJ, Wu JT, Feng L, Guan Y, Yu H, et al. Interventions to reduce zoonotic and pandemic risks from avian influenza in Asia. Lancet Infect Dis. 2016;16:252–8.
- Cowling BJ, Jin L, Lau EHY, Liao Q, Wu P, Jiang H, et al. Comparative epidemiology of human infections with avian influenza A H7N9 and H5N1 viruses in China: a population-based study of laboratory-confirmed cases. Lancet. 2013;382:129–37.
- Jiang H, Wu P, Uyeki TM, He J, Deng Z, Xu W, et al. Preliminary epidemiologic assessment of human infections with highly pathogenic avian influenza A(H5N6) virus, China. Clin Infect Dis. 2017;65:383–8.
- Wu J, Ke C, Lau EHY, Song Y, Cheng KL, Zou L, et al. Influenza H5/H7 virus vaccination in poultry and reduction of zoonotic infections, Guangdong Province, China, 2017–18. Emerg Infect Dis. 2019;25:116–8.
- Leung YHC, Zhang LJ, Chow CK, Tsang CL, Ng CF, Wong CK, et al. Poultry drinking water used for avian influenza surveillance. Emerg Infect Dis. 2007;13:1380–2.
- Wang X, Wang Q, Cheng W, Yu Z, Ling F, Mao H, et al. Risk factors for avian influenza virus contamination of live poultry markets in Zhejiang, China during the 2015-2016 human influenza season. Sci Rep. 2017;7:42722.
- Yuan J, Lau EH, Li K, Leung YH, Yang Z, Xie C, et al. Effect of live poultry market closure on avian influenza A(H7N9) virus activity in Guangzhou, China, 2014. Emerg Infect Dis. 2015;21:1784–93.
- Kang M, He J, Song T, Rutherford S, Wu J, Lin J, et al. Environmental sampling for avian influenza A(H7N9) in live-poultry markets in Guangdong, China. PLoS One. 2015;10:
e0126335 . - Fang S, Bai T, Yang L, Wang X, Peng B, Liu H, et al. Sustained live poultry market surveillance contributes to early warnings for human infection with avian influenza viruses. Emerg Microbes Infect. 2016;5:
e79 . - Kim Y, Biswas PK, Giasuddin M, Hasan M, Mahmud R, Chang YM, et al. Prevalence of avian influenza A(H5) and A(H9) viruses in live bird markets, Bangladesh. Emerg Infect Dis. 2018;24:2309–16.
- Lindsley WG, Green BJ, Blachere FM, Martin SB, Law BF, Jensen PA, et al. Sampling and characterization of bioaerosols. In: NIOSH manual of analytical methods, 5th edition. Cincinnati: National Institute for Occupational Safety and Health, Centers for Disease Control and Prevention; 2017.
- Chinese Center for Diseases Control and Prevention. Avian influenza surveillance programme [cited 2019 June 17].
- World Health Organization. WHO information for the molecular detection of influenza viruses; 2017 [cited 2019 June 8].
- National Oceanic and Atmosphere Administration. Station data inventory, access and history [cited 2019 June 8].
Figures
Tables
Cite This ArticleOriginal Publication Date: 1/9/2020
1These authors contributed equally to this article.
2These senior authors contributed equally to this article.


.png)


No hay comentarios:
Publicar un comentario