Morphometry and Functional Assessment in Mice Using Cardiac MR Imaging
Introduction
Over the past 10 years, the field of cardiovascular MR (CMR) has progressed quickly, driving novel applications across a wide range of research fields.
CMR is applied to assess:
- Cardiac anatomy
- Regional wall motion
- Myocardial viability
- Myocardial perfusion
- Cardiac function assessment
- Cardiac chamber quantification
Cardiac MR research involves assessment of:
- Myocardial injury and myocardial infarction
- Explorations into pharmacologically or genetically induced hypertension
- Characterization of regression and progression of myocardial hypertrophy induced by pressure overload or exercise
- Detection of sex or hormonal specific effects of cardiac (dys) function and cardiac damage
Functional cardiac MR imaging
Dynamic MR imaging of the heart to assess cardiac morphology, wall motion, and myocardial contractile function needs high blood/muscle contrast, high temporal resolution, and complete coverage of the cardiac cycle. Echo-based CINE imaging techniques are thus employed to balance these constraint gradients.
Cardiac MRI is not a real time imaging technique and therefore, acquisition of modality data is propagated over a sequence of heart beats which has to be synchronized with the cardiac cycle. Based on this reason, ECG is generally employed for cardiac gating.
However, interference with the magnetic field affects ECG, which is an electrical measurement and this interference is more pronounced at 9.4 T which is an ultra high field. Therefore, self gating methods for example IntraGate are an extremely useful option for robust cardiac imaging in mice and do not affect the precision of the myocardial function parameters derived [3-4].
Experimental protocol
Factors like the animals heart rates that range from 400 to 600 beats per minute (bpm) as well as its small size, call for dedicated cardiac software/ hardware and customized imaging procedures to obtain appropriate spatial and temporal resolution for CMR in mice.
Hardware
Hardware used are Bruker Biospec 94/20, and Bruker linear volume resonator (ID 72 mm) utilized for signal transmission in tandem with Bruker four-element cardiac coil array employed for signal reception.
Imaging protocol and sequence parameters
Acceptable image quality can be obtained only through cardiac gating. Retrospective gating is enabled by the IntraGateFLASH sequence and is hence proposed as it is non-invasive, offers better contrast to-noise and signal-to-noise[4], more user friendly, and more reliable when compared to subcutaneous ECG needle electrodes.
IntraGateFLASH can reduce if not prevent R-wave misregistration that is often experienced with ECG gating. In fact, IntraGate considerably reduces the time taken to prepare animals, particularly in a high through-put setting. A predicted respiration rate and heart rate (acquired from the physiological monitoring) are needed by the sequence of Intra-GateFLASH a priori. Four sets of scans are included in the LV function assessment protocol:
- Scan 1): This includes ScanMode ‘PilotScan’, tri-pilot multi slice, TE 1.5 ms, TR 85 ms, FOV 35 mm, 3x7 slices of 0.7 mm thickness, 10 repetitions
- Scan 2 & 3): This includes ScanMode ‘RetrospectiveGating’, single slice IntraGateFLASH cine, TE 2.9 ms, TR 5 ms, FOV 35 mm, matrix size 128 zero-filled to 256, 0.7 mm thickness, 30 repetitions, and 10 cardiac movie frames (cardiac phases)
- n Scan 4): This includes Multi slice IntraGateFLASH cine, TE 2.1 ms, TR 72 ms, FOV 30 mm, matrix size 192x128 zero-filled to 256, 8 slices of 0.8 mm thickness, 70 repetitions, 20 cardiac movie frames (cardiac phases), and acquisition time 10 minutes 51 seconds
Anesthesia and physiological monitoring
For anesthesia, Isoflurane of 1.0 to 2.0% in a mixture of air/O2 with flow rates of 200 ml/minute each was used. A small animal monitoring and gating system (Model 1025, SA Instruments, Inc., Stony Brook, NY, USA), which is MR compatible, was used to monitor respiration rate, heart rate, and body temperature (through pulse oximeter). On the heart array coil, animals are positioned in a prone fashion and through warm water heating a stable body temperature is maintained.
Planning of standard cardiac views
Cardiac MRI in mice has three established standard views:
- Short axis view (SAX)
- Long axis two chamber view (2CV)
- Long axis four chamber view (4CV)
These views should be obtained in a number of steps because of the hearts double oblique orientation. This begins with a multi-slice tri-pilot. After the tri-pilot (scan 1) is acquired, reference scan 2 must be planned on a coronal view to make sure that the slice joins the center and apex of the left mitral valve or atrioventricular valve, as shown in Figure 1 (left). For the subsequent scan (scan 3), the slice is positioned in the same way but vertical to the reference scan 2, as illustrated in Figure 1 (center). Lastly, the SAX slice package is placed perpendicular to the long heart axis and also perpendicular to the reference scan 3.
In order to assess quantitative LV function and cardiac chamber quantification, the slice package should cover the whole left ventricle from the apex to the mitral valve or atrioventricular valve for all cardiac phases.
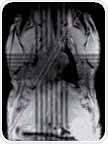

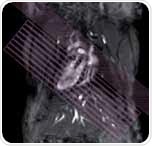
Figure 1. Planning the geometry of a short axis (SAX) slice package, shown are scans 1, 2 and 3.
The first slice must be placed right below the mitral valve located in end diastole, and the last slice should no longer show any lumen. For improved blood/endocardium contrast, blood is suppressed by positioning a saturation band over the atria that is parallel to the imaging slice package, leaving a gap of about one slice thickness.
The saturation slice thickness should be adequately wide to cover the atria as well as afferent vessels (pulmonary vein and venae cavae), as depicted in Figure 1 (right). The 4CV and 2CV views can then be planned on the SAX view, where a slice is perpendicularly rotated such that it runs through the middle of the left ventricle. It also runs through the right ventricle at its biggest extend in the case of the 4CV view. The 2CV view will not cross the right ventricle, but should be rotated by 90°, that is, perpendicular to 4CV and SAX views.
Image analysis
There is a standard belief that assessment of left ventricular using image segmentation simply involves drawing several circles around the myocardium. However, first class data analysis is very significant for the assessment of LV function to ensure that the variability of mean inter-observer is less than 5%. Therefore, epicardial and endocardial borders, shown in Figure 2, should be carefully segmented.
This has to be done through manual segmentation. and to achieve this in this case, commercially available software (for instance Mass4Mice, Medis, Leiden, The Netherlands) is recommended. Another option is to use automated segmentation methods that can help bring down the bias of inter- and intra- observer variability [5-6]. Both endocardial and epicardial borders are segmented for all slices spanning the left ventricle for cardiac phases resulting from end diastole and end systole (Figure 3). The results obtained include:
- the end diastolic volume (LVEDV) in ml
- the end systolic volume (LVESV) in ml
- the stroke volume in ml
- the left ventricular ejection fraction (LVEF) in percent
- the ventricular mass (LVM)

Figure 2. Analysis of short axis slice package. Manual segmentation of the left and right ventricles.
Right ventricle can also be quantitatively analyzed but this can be very difficult because it is relatively thin and at times too complex to define against the surrounding tissue. Both right and left ventricles should be preferably captured in separate scans.
Optimum placement of the flow saturation bands and entire coverage of the right ventricle are achieved by two separate scans. Blood saturation can be further improved through multi-oblique orientation of the saturation slice with regard to the imaging slices.
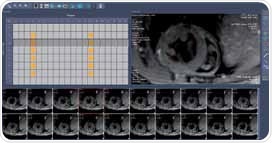
Figure 3. Survey of whole heart 2D CINE short axis views of a mouse heart obtained at 9.4 T and basic overview of its use for LV function assessment and cardiac chamber quantification. For LV function assessment LV endo- and epicardial contours were manually traced for each slice for end-diastolic and end-systolic images.
Results and discussion
Figure 4 shows SAX views that include an end diastolic phase covering from the apex to the base of a normal mouse. The regional flow saturation band suppresses the blood which is usually white in FLASH sequences and therefore appears black (black blood technique). Using this method, flow artefacts can be prevented and improved blood/myocardium contrast can be obtained, this helps in the delineation of myocardium.
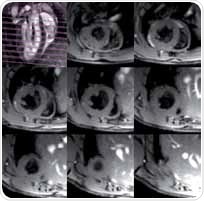
Figure 4. SAX view of a healthy mouse heart at end diastole. Top left: geometry of SAX slices and flow saturation band. Top center to bottom right: eight SAX slices going from below the atria down to the apex.
In Figure 5, SAX views obtained from a healthy mouse heart (left) are compared with images acquired from animal models of myocardial infarction (right and middle). In view of this purpose, occlusion of the LAD (left anterior descending) coronary artery was then applied. For segments in the lateral (right) and anterior (center) wall, considerable thinning of the wall can be seen clearly.
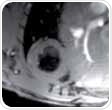
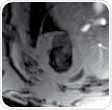
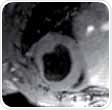
Figure 5. SAX views of a healthy mouse heart (left) and hearts four weeks after a myocardial infarction (center and right), shown in diastole.
A 4CV of a healthy mouse heart (left) and a heart — four weeks following a myocardial infarction (LAD occlusion) in diastole are shown in Figure 6. The left ventricle is distinctly enlarged and the apical segments of the myocardium are reduced to an extremely thin layer. Here, further blood suppression was not applied.
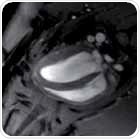
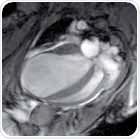
Figure 6. Four chamber views (4CV) of a healthy mouse heart (left) and a heart four weeks after a myocardial infarction (right), shown in diastole.
Practical remarks
While the 4CV and SAX views reveal the gross effects of myocardial infarction, like those illustrated in Figure 5 and Figure 6, this does not necessarily give any quantitative data regarding the underlying pathology, which is important in most studies. Subtle pathologies may not be detected as well. Group statistics as well as measurement of significance levels are enabled by quantitative analysis.
Severe myocardial infarction will certainly result in impaired function and thus a reduced ejection fraction (EF), while hypertension may cause hyperthrophy and thus lead to an increased left ventricular mass. Ideally, the sum of both ventricular masses should amount to the exact heart weight that is acquired from post mortem measurement. Here, care should be taken as this correlation mainly relies on the thickness of myocardial tissue which is employed in the data analysis software to obtain the ventricular mass from the myocardium volume.
Systematic errors during segmentation and imperfect heart coverage or suboptimal slice positioning are other potential reasons for discrepancies. While the absolute heart mass derived from MRI in vivo may deviate from ex vivo quantification, here it was preferred to highlight the linear regression of R>0.94 between both techniques.
Relative changes are also a useful measure for rapid phenotyping or pathology in group studies or longitudinal studies with a corresponding control group. For instance, shown in Figure 7 are LVEDV and EF differences in mice post myocardial infarction as opposed to a control group.
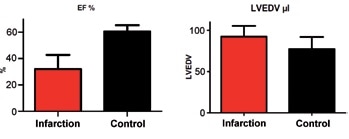
Figure 7. Comparison of mice after infarction with control animals (n=8). Parameters derived from cardiac chamber quantification using CMR. Significant differences occurred in the EF (left, reduced after infaction, p < 0.0001) and LVEDV (right, increased after infaction, p < 0.05).
Pre-histological screening of mice embryos by ex vivo cardiac MRI
In the case of genetically modified mice, congenital abnormalities may already be detected in embryos. The undeveloped heart can be adequately revealed by 3D ultra high resolution ex-vivo MRI which can help review morphological abnormalities [7]. An axial slice of mice embryos, embedded in agarose and fixed in contrast agent, is shown in Figure 8.
Using a 600x512x512 acquisition matrix and a quadrature mouse volume coil (ID 35mm), the overnight scan was carried out. This resulted in a 53-micrometer isotropic spatial resolution. While higher spatial resolution can be obtained using the Bruker CryoCoil, many animals can be simultaneously screened in a reasonable amount of time using the room temperature mouse volume coil. Based on this information, histological analysis can be restricted to a subset, that is only a controllable number of specific animals.
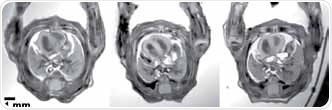
Figure 8. μMRI with an isotropic resolution of 53 um, which allows the assessment of heart morphology in mouse embryos. The diameter of the hearts shown in these images is merely approx. 2 mm.
Parametric tissue mapping
In addition, CMR is increasingly being used to monitor non-invasive myocardial injury on a tissue level through parametric mapping and quantification of MR signal changes, providing quantitative information as illustrated for a healthy mice in Figure 9.
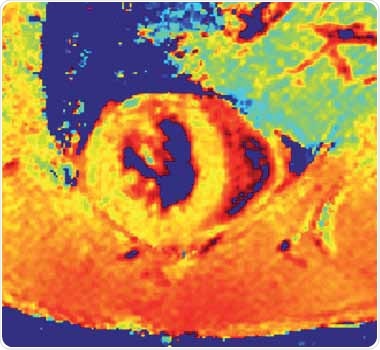
Figure 9. Myocardial T1* map of a normal mouse (SAX view).
The loss of structural homogeneity in myocardium in support of collagen or fibrotic tissue is believed to cause changes in the native T1, relaxation times of myocardium as well as in the T2 relaxation times. However, accurate T1 mapping is made difficult because small rodents are known to have high heart rates.
Look-Locker is a commonly used technique (in this case Bruker trigFisp) that offers excellent image quality and more than enough time points for T1-mapping within a viable acquisition time[8]. It must however be remembered that this method is incapable of providing the exact T1 values of the tissue, but T1*, which strongly relies on the effective equilibrium longitudinal magnetization and thus on the acquisition parameters.
The method, applied in present research practice, samples many time points along the T1recovery through a permanent sampling interval, assuming fixed R-R interval length or constant heart rates for T1-quantification. This can however be a problem because when there are erratic heart rates during imaging, data will be obtained at variable time points of the T1 recovery and result in a major source of error in quantified T1 values.
This is obvious when imaging mice models, where myocardium’s T1 relaxation times are considerably longer than that of several R-R intervals. Such issues can be handled by dynamic triggering (excitation loop running without obtaining data while waiting for the subsequent R-wave) as well as retrospective assignment of MR information to the T1-recovery curve.
Outlook
Better image quality can be obtained using cryogenically cooled RF coils for CMR in mice, leading to more enhanced sensitivity than traditional room temperature RF-coils. It must be remembered that enhanced sensitivity is equivalent to an increased magnetic field strength but without the additional complications, and at times cost prohibitive, that are common in ultrahigh field MRI.
Summary
With increasing application of cardiac MR imaging in animal research, MRI capabilities for the assessment of heart disease should be further developed. In brief, present small animal CMR studies continue to be in a state of creative flux, but productive engagement in this field still drives more advancement and helps synchronize the results obtained from basic research scenario and preclinical imaging with that of clinical imaging.
References
- Vallee, J.P., et al., Current status of cardiac MRI in small animals. MAGMA, 2004. 17(3-6): p. 149-56.
- Epstein, F.H., MR in mouse models of cardiac disease. NMR Biomed, 2007. 20(3): p. 238-55.
- Ratering, D., et al., Accelerated cardiovascular magnetic resonance of the mouse heart using self-gated parallel imaging strategies does not compromise accuracy of structural and functional measures. J Cardiovasc. Magn Reson, 2010. 12: p. 43.
- Bovens, S.M., et al., Evaluation of infarcted murine heart function: comparison of prospectively triggered with self-gated MRI. NMR Biomed, 2011. 24(3): p. 307-15
- Heijman, E., et al., Evaluation of manual and automatic segmentation of the mouse heart from CINE MR images. J Magn Reson Imaging, 2008. 27(1): p. 86-93.
- Young, A.A., et al., Fast left ventricular mass and volume assessment in mice with three-dimensional guide-point modeling. J Magn Reson Imaging, 2009. 30(3): p. 514-20.
- Schneider, J.E., et al., Identification of cardiac malformations in mice lacking Ptdsr using a novel high-throughput magnetic resonance imaging technique. BMC Dev Biol, 2004. 4: p. 16.
- Li, W., M. Griswold, and X. Yu, Rapid T1 mapping of mouse myocardium with saturation recovery Look-Locker method. Magn Reson Med, 2010. 64(5): p. 1296-303.
About Bruker
Bruker delivers the world's most comprehensive range of research tools enabling life science, materials science, analytical chemistry, process control and clinical research. Bruker is also the leading superconductor magnet and ultra high field magnet manufacturer for NMR and MRI solutions.
Sponsored Content Policy: News-Medical.net publishes articles and related content that may be derived from sources where we have existing commercial relationships, provided such content adds value to the core editorial ethos of News-Medical.Net which is to educate and inform site visitors interested in medical research, science, medical devices and treatments.
Last updated: Sep 15, 2017 at 10:23 AM


.png)


No hay comentarios:
Publicar un comentario