
QuickStats: Age-Adjusted Death Rates* for Motor Vehicle Traffic Injury† — United States, 2016
Weekly / August 10, 2018 / 67(31);872
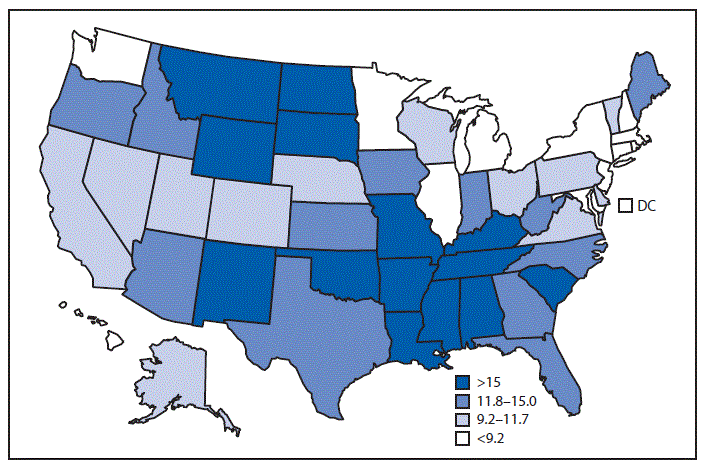
Abbreviation: DC = District of Columbia.
* Rates are deaths per 100,000 standard population.
† Motor vehicle traffic injuries are identified with International Classification of Disease, Tenth Revision (ICD–10) codes V02–V04[.1,.9],V09.2,V12–V14[.3–.9],V19[.4–.6],V20–V28[.3–.9],V29– V79[.4–.9],V80[.3–.5],V81.1,V82.1,V83– V86[.0–.3],V87[.0–.8],V89.2).
In 2016, the death rate in the United States for motor vehicle traffic injury was 11.7 per 100,000 standard population. The three states with the highest age-adjusted death rates were Mississippi (25.4), Alabama (23.3), and South Carolina (20.9). New York (5.3), Rhode Island (5.0), and the District of Columbia (4.5) had the lowest rates.
Source: National Vital Statistics System. Underlying cause of death data, 2016. https://wonder.cdc.gov/ucd-icd10.html.
Reported by: Arialdi M. Minino, MPH, AMinino@cdc.gov, 301-458-4376; Sally C. Curtin, MA.


.png)


No hay comentarios:
Publicar un comentario