NCHS Data Brief
Number 173, December 2014
Current Contraceptive Status Among Women Aged 15–44: United States, 2011–2013
PDF Version  (639 KB)
(639 KB)Kimberly Daniels, Ph.D.; Jill Daugherty, Ph.D.; and Jo Jones, Ph.D.
Key findings
Data from the 2011–2013 National Survey of Family Growth
- In 2011–2013, 61.7% of the 60.9 million women aged 15–44 in the United States were currently using contraception. The most common contraceptive methods currently being used were the pill (16.0%), female sterilization (15.5%), male condoms (9.4%), and long-acting reversible contraceptives (7.2%).
- Use of long-acting reversible contraceptives was higher among women aged 25–34 (11.1%) compared with women aged 15–24 (5.0%) and aged 35–44 (5.3%).
- Current condom use was similar across the three Hispanic origin and race groups shown in this report (about 9%).
- Current use of female sterilization declined, and use of the pill increased with greater educational attainment. Use of long-acting reversible contraceptives was similar across education, about 8%–10%.
Nearly all women use contraception at some point in their lifetimes (1), although at any given time they may not be using contraception for reasons such as seeking pregnancy, being pregnant, or not being sexually active. Using data from the 2011–2013 National Survey of Family Growth (NSFG) on contraceptive use in the month of the interview, this report provides a snapshot of current contraceptive status among women aged 15–44 in the United States. In addition to describing use of any method by age, Hispanic origin and race, and educational attainment, patterns of use are described for the four most commonly used contraceptive methods: the oral contraceptive pill, female sterilization, the male condom, and long-acting reversible contraceptives, which include contraceptive implants and intrauterine devices (2).
Keywords: pill, condom, long-acting reversible contraceptives, National Survey of Family Growth
In 2011–2013, approximately 62% of women aged 15–44 were currently using contraception.
Figure 1. Percentage currently using any contraceptive method among all women aged 15–44, by selected characteristics: United States, 2011–2013
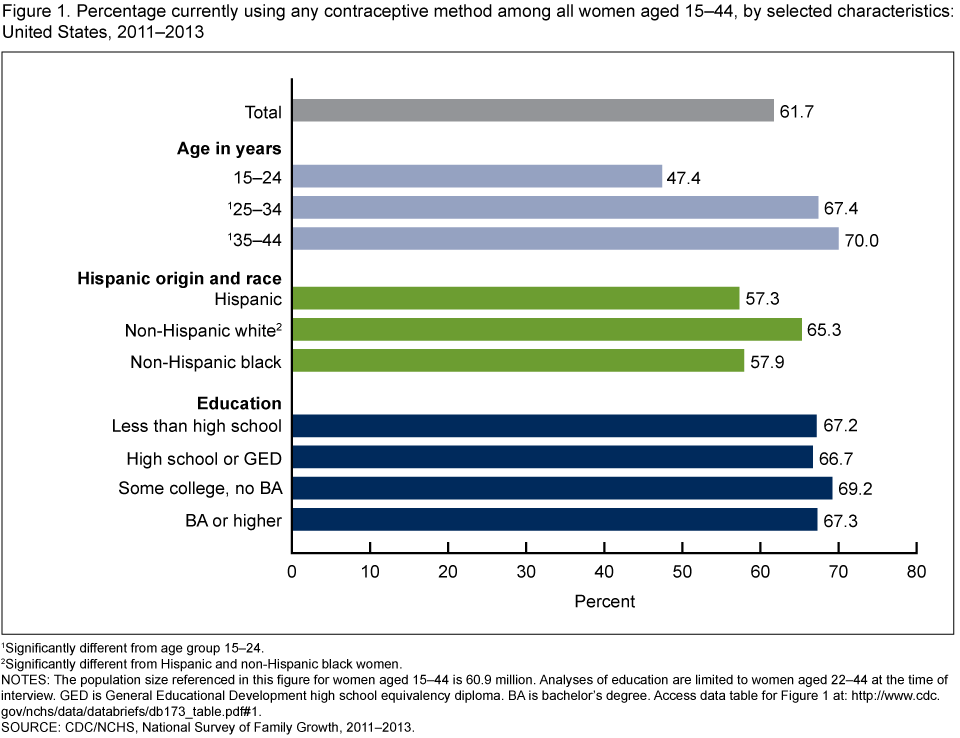
1Significantly different from age group 15–24.
2Significantly different from Hispanic and non-Hispanic black women.
NOTES: The population size referenced in this figure for women aged 15–44 is 60.9 million. Analyses of education are limited to women aged 22–44 at the time of interview. GED is General Educational Development high school equivalency diploma. BA is bachelor’s degree. Access data table for Figure 1 [PDF - 111KB].
SOURCE: CDC/NCHS, National Survey of Family Growth, 2011–2013.
2Significantly different from Hispanic and non-Hispanic black women.
NOTES: The population size referenced in this figure for women aged 15–44 is 60.9 million. Analyses of education are limited to women aged 22–44 at the time of interview. GED is General Educational Development high school equivalency diploma. BA is bachelor’s degree. Access data table for Figure 1
[PDF - 111KB].SOURCE: CDC/NCHS, National Survey of Family Growth, 2011–2013.
- In 2011–2013, 61.7% or 37.6 million of the 60.9 million women aged 15–44 in the United States were currently using a method of contraception (Figure 1).
- Current contraceptive use was higher among women aged 25–34 (67.4%) and 35–44 (70.0%) compared with women aged 15–24 (47.4%).
- A higher percentage of non-Hispanic white women (65.3%) was currently using contraception compared with Hispanic women (57.3%) and non-Hispanic black women (57.9%).
- Current contraceptive use was similar across education (67%–69%).
The pill, female sterilization, condoms, and long-acting reversible contraceptives were the most common methods women were currently using.
- The most common contraceptive methods currently being used were the oral contraceptive pill (16.0%), female sterilization (15.5%), condoms (9.4%), and long-acting reversible contraceptives (7.2%) (Figure 2).
- Approximately 38% of women were not currently using contraception.
Figure 2. Percent distribution of women aged 15–44, by current contraceptive status: United States, 2011–2013
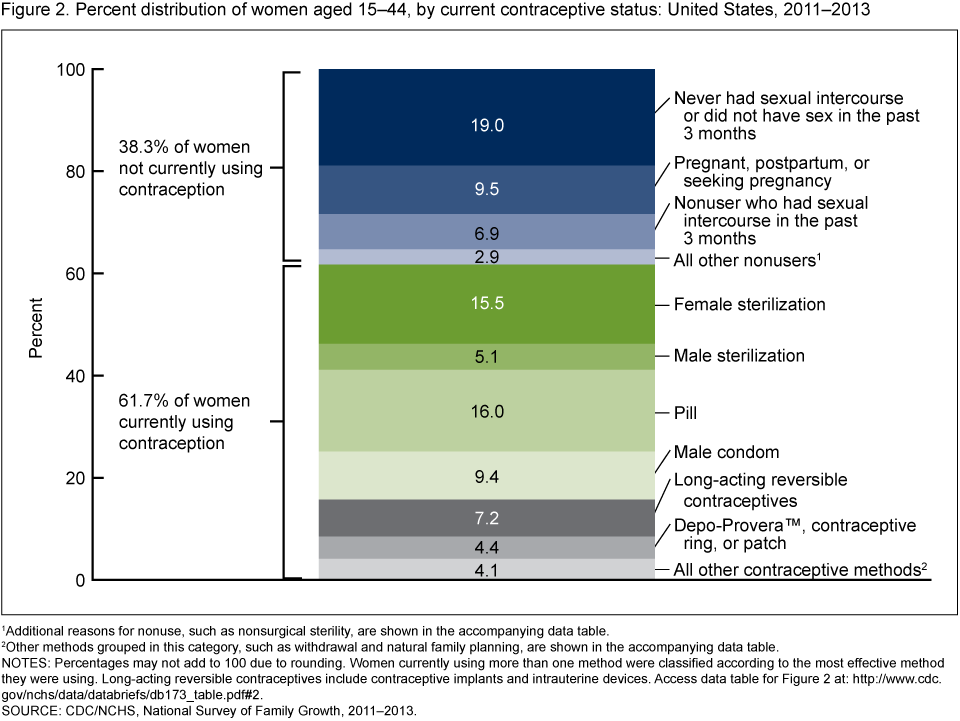
1Additional reasons for nonuse, such as nonsurgical sterility, are shown in the accompanying data table.
2Other methods grouped in this category, such as withdrawal and natural family planning, are shown in the accompanying data table.
NOTES: Percentages may not add to 100 due to rounding. Women currently using more than one method were classified according to the most effective method they were using. Long-acting reversible contraceptives include contraceptive implants and intrauterine devices. Access data table for Figure 2 [PDF - 111KB].
SOURCE: CDC/NCHS, National Survey of Family Growth, 2011–2013.
2Other methods grouped in this category, such as withdrawal and natural family planning, are shown in the accompanying data table.
NOTES: Percentages may not add to 100 due to rounding. Women currently using more than one method were classified according to the most effective method they were using. Long-acting reversible contraceptives include contraceptive implants and intrauterine devices. Access data table for Figure 2
[PDF - 111KB].SOURCE: CDC/NCHS, National Survey of Family Growth, 2011–2013.
Current use of female sterilization, the pill, condoms, and long-acting reversible contraceptives varied by age.
- A higher percentage of women aged 35–44 was using female sterilization compared with younger women. Nearly one in three women aged 35–44 (31.0%) used female sterilization compared with less than 1% of women aged 15–24 (0.7%) (Figure 3).
- Pill use was higher among younger women. Almost 1 woman out of 4 aged 15–24 (22.4%) was currently using the pill compared with about 1 woman in 12 aged 35–44 (8.7%).
- Similar percentages of women aged 15–24 (10.1%) and 25–34 (11.5%) were using condoms; use was lower among women aged 35–44 (6.6%).
- Use of long-acting reversible contraceptives was higher among women aged 25–34 (11.1%) compared with women aged 15–24 (5.0%) and with women aged 35–44 (5.3%).
Figure 3. Percentage of all women aged 15–44 who were using female sterilization, the pill, the male condom, and long-acting reversible contraceptives, by age: United States, 2011–2013
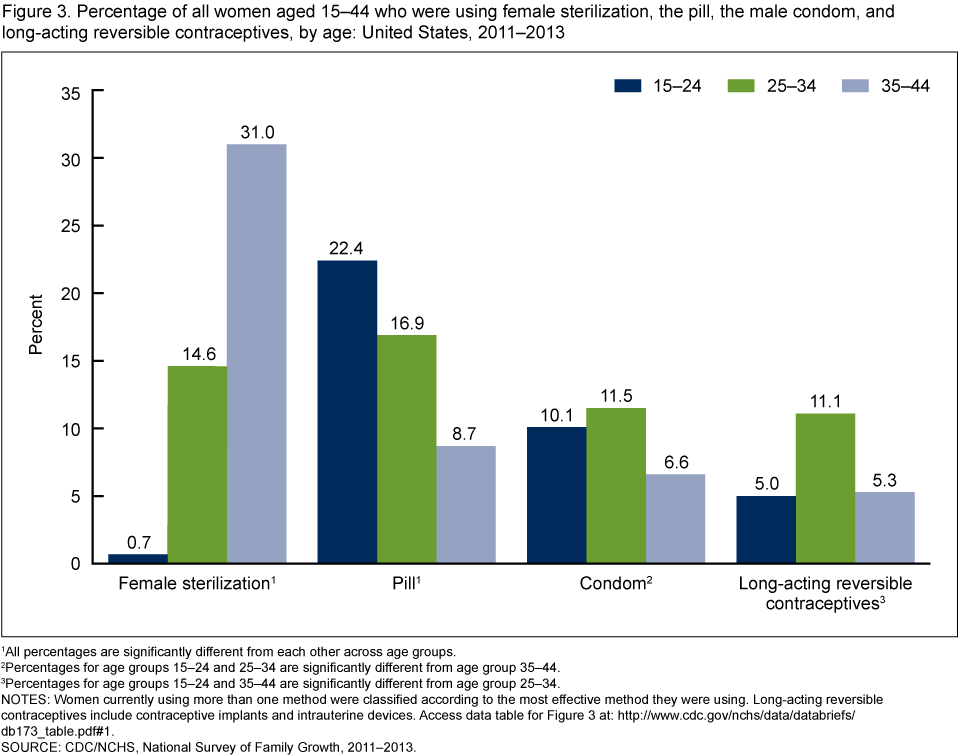
1All percentages are significantly different from each other across age groups.
2Percentages for age groups 15–24 and 25–34 are significantly different from age group 35–44.
3Percentages for age groups 15–24 and 35–44 are significantly different from age group 25–34.
NOTES: Women currently using more than one method were classified according to the most effective method they were using. Long-acting reversible contraceptives include contraceptive implants and intrauterine devices. Access data table for Figure 3 [PDF - 111KB].
SOURCE: CDC/NCHS, National Survey of Family Growth, 2011–2013.
2Percentages for age groups 15–24 and 25–34 are significantly different from age group 35–44.
3Percentages for age groups 15–24 and 35–44 are significantly different from age group 25–34.
NOTES: Women currently using more than one method were classified according to the most effective method they were using. Long-acting reversible contraceptives include contraceptive implants and intrauterine devices. Access data table for Figure 3
[PDF - 111KB].SOURCE: CDC/NCHS, National Survey of Family Growth, 2011–2013.
Current contraceptive method use varied by Hispanic origin and race.
- Current use of female sterilization was higher among non-Hispanic black women (21.3%) compared with non-Hispanic white women (14.0%) (Figure 4).
- Current use of the pill was higher among non-Hispanic white women (19.0%) than among Hispanic (10.9%) and non-Hispanic black (9.8%) women.
- Current condom use was similar across the three Hispanic origin and race groups shown, around 9%.
- Current use of long-acting reversible contraceptives was higher among Hispanic (8.7%) and non-Hispanic white (7.4%) women compared with non-Hispanic black women (5.0%).
Figure 4. Percentage of all women aged 15–44 who were currently using female sterilization, the pill, the male condom, and long-acting reversible contraceptives, by Hispanic origin and race: United States, 2011–2013
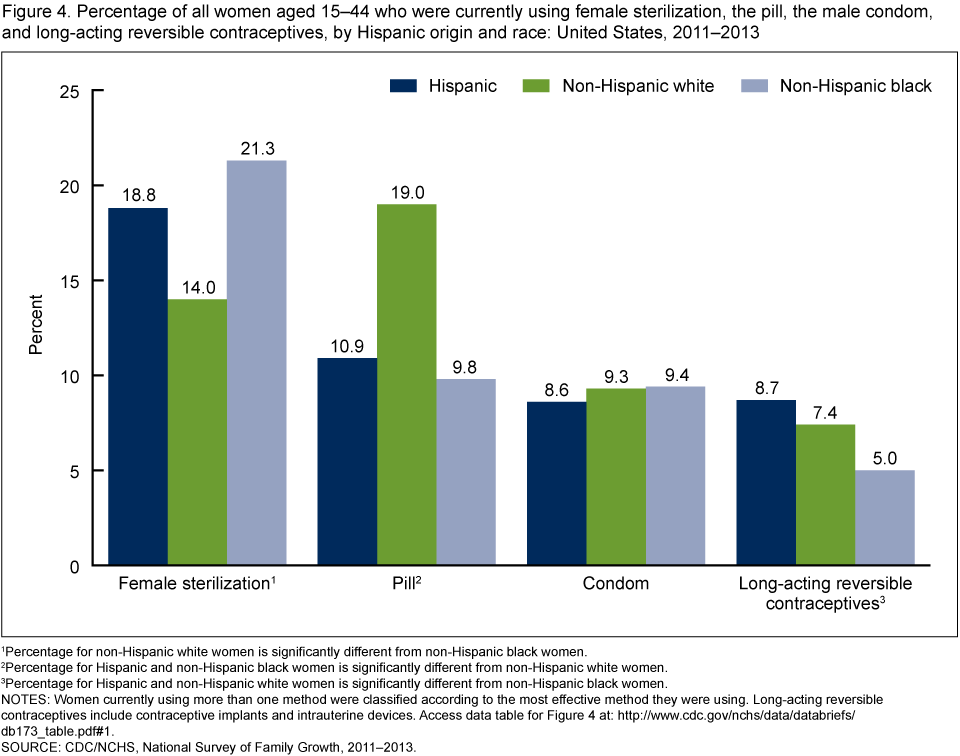
1Percentage for non-Hispanic white women is significantly different from non-Hispanic black women.
2Percentage for Hispanic and non-Hispanic black women is significantly different from non-Hispanic white women.
3Percentage for Hispanic and non-Hispanic white women is significantly different from non-Hispanic black women.
NOTES: Women currently using more than one method were classified according to the most effective method they were using. Long-acting reversible contraceptives include contraceptive implants and intrauterine devices. Access data table for Figure 4 [PDF - 111KB].
SOURCE: CDC/NCHS, National Survey of Family Growth, 2011–2013.
2Percentage for Hispanic and non-Hispanic black women is significantly different from non-Hispanic white women.
3Percentage for Hispanic and non-Hispanic white women is significantly different from non-Hispanic black women.
NOTES: Women currently using more than one method were classified according to the most effective method they were using. Long-acting reversible contraceptives include contraceptive implants and intrauterine devices. Access data table for Figure 4
[PDF - 111KB].SOURCE: CDC/NCHS, National Survey of Family Growth, 2011–2013.
Current use of female sterilization and the pill varied by educational attainment, while current condom and long-acting reversible contraceptive use did not.
- Current use of female sterilization declined with greater educational attainment; 27.0% of women with a high school diploma or GED were using female sterilization compared with 10.3% of women with a bachelor’s degree or higher (Figure 5).
- Current pill use was more common with greater educational attainment. One in 5 women (21.5%) with a bachelor’s degree or higher was using the pill. Fewer than 1 woman in 20 (3.6%) without a high school diploma or GED was using the pill.
- Similar percentages of women across education groups were currently using condoms (8%–11%) or long-acting reversible contraceptives (8%–10%).
Figure 5. Percentage of all women aged 22–44 who were currently using female sterilization, the pill, the male condom, and long-acting reversible contraceptives, by educational attainment: United States, 2011–2013
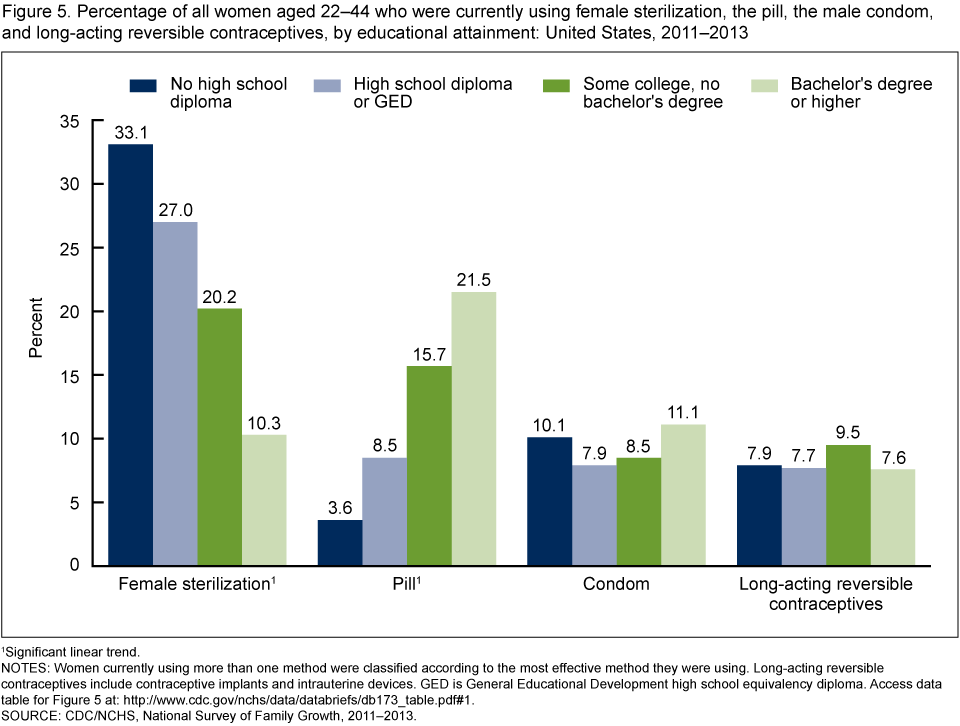
1Significant linear trend.
NOTES: Women currently using more than one method were classified according to the most effective method they were using. Long-acting reversible contraceptives include contraceptive implants and intrauterine devices. GED is General Educational Development high school equivalency diploma. Access data table for Figure 5 [PDF - 111KB].
SOURCE: CDC/NCHS, National Survey of Family Growth, 2011–2013.
NOTES: Women currently using more than one method were classified according to the most effective method they were using. Long-acting reversible contraceptives include contraceptive implants and intrauterine devices. GED is General Educational Development high school equivalency diploma. Access data table for Figure 5
[PDF - 111KB].SOURCE: CDC/NCHS, National Survey of Family Growth, 2011–2013.
Summary
In 2011–2013, approximately 62% of women aged 15–44 were using some type of contraceptive method while 38% were not currently using a method. This is unchanged from the percentage in 2006–2010 (62.2% using contraception) (3). Women were not using contraception for various reasons such as seeking pregnancy, being pregnant or postpartum, or not being sexually active. Current use of any method of contraception was higher among older women and non-Hispanic white women compared with younger women and those of other Hispanic origin and race groups shown. The most commonly used methods were the pill (16.0%), female sterilization (15.5%), condoms (9.4%), and long-acting reversible contraceptives (7.2%). There was variation in the use of these four methods across age, Hispanic origin and race, and educational attainment.
Understanding variation in contraceptive use across social and demographic characteristics offers potential insight into larger fertility patterns, including birth rates and incidence of unintended pregnancies. The chance that a woman not seeking a pregnancy will have an unintended pregnancy varies by whether any method of contraception is used and which method she or her partner uses (4). Using the most recent NSFG data available, this report provides a snapshot of current contraceptive use among U.S. women aged 15–44 in an effort to increase understanding of contraceptive use.
Definitions
Age: Refers to the respondent’s age at the time of the interview. The recode variable used was AGER.
Contraceptive status: Measures the contraceptive method used (if any) in the month of the interview (not at a specific act of sexual intercourse). The recode variable used was CONSTAT1. In this report, as in prior NSFG reports (3), women who were currently using more than one method are classified by the method that was most effective in preventing pregnancy, because that method has the greatest impact on their risk of unintended pregnancy. For example, women who report using both birth control pills and male condoms in the current month are classified as using birth control pills because pills are more effective at preventing a pregnancy. In 2011–2013, 10.7% of women who were currently using contraception used more than one contraceptive method during the same month.
Education: Educational attainment at the time of interview, indicating the highest degree or grade finished. Results are presented only for women aged 22 and over as many younger women had not completed their education (75% of women aged 15–21 were in school at the time of the interview; analysis not shown). The recode variable used was HIEDUC.
Hispanic origin and race: The Office of Management and Budget (OMB) guidelines for the presentation of race and origin data in federal statistics are used for these classifications (5). The 1997 OMB guidelines that allow respondents to report more than one race or ethnic origin are followed and the recode variable, HISPRACE2, is used. In this report, the categories Hispanic, non-Hispanic white single race, and non-Hispanic black single race are presented. Given the diversity of women categorized as non-Hispanic other single and multiple race, those results are not shown here.
Data source and methods
This report is based on data from the 5,601 women in the female respondent file of the 2011–2013 NSFG. Among other information, NSFG provides detailed information about contraceptive use among U.S. women aged 15–44. The fieldwork plan, interview content, and other procedures of the survey are similar to what was done in previous surveys (6). NSFG is jointly planned and funded by the Centers for Disease Control and Prevention’s National Center for Health Statistics and several other programs of the U.S. Department of Health and Human Services. All estimates in this report were weighted to reflect the U.S. female household population aged 15–44 across the midpoint of 2011–2013 interviewing (July 2012).
Statistics for this report were produced using the SURVEY procedures in SAS software version 9.3. Percentages were compared using two-tailed t tests at the 5% level. No adjustments were made for multiple comparisons. A weighted least squared regression was used to test differences across education. The data presented in this report are bivariate associations that may be explained by other factors not controlled for in the figures or included in the report. For example, women at older ages were more likely to have completed their childbearing compared with women at younger ages. Therefore women at younger ages would be more likely to choose nonpermanent contraceptive methods including the pill, condoms, and long-acting reversible contraceptives compared with female sterilization, a mostly nonreversible form of contraception (3).
About the authors
Kimberly Daniels, Jill Daugherty, and Jo Jones are with CDC’s National Center for Health Statistics, Division of Vital Statistics.
References

Suggested citation
Daniels K, Daugherty J, Jones J. Current contraceptive status among women aged 15–44: United States, 2011–2013. NCHS data brief, no 173. Hyattsville, MD: National Center for Health Statistics. 2014.
Copyright information
All material appearing in this report is in the public domain and may be reproduced or copied without permission; citation as to source, however, is appreciated.
National Center for Health Statistics
Charles J. Rothwell, M.S., M.B.A., Director
Jennifer H. Madans, Ph.D., Associate Director for Science
Jennifer H. Madans, Ph.D., Associate Director for Science
Division of Vital Statistics
Delton Atkinson, M.P.H., M.P.H., P.M.P., Director


.png)


.png)


No hay comentarios:
Publicar un comentario