07/22/2013 10:12 PM EDT
Source: National Center for Health Statistics
Related MedlinePlus Pages: Health Disparities, Health Statistics
Related MedlinePlus Pages: Health Disparities, Health Statistics
NCHS Data Brief
Number 125, July 2013
How Did Cause of Death Contribute to Racial Differences in Life Expectancy in the United States in 2010?
On This Page
- Key findings
- What are the current trends in life expectancy?
- How does life expectancy differ by race and sex?
- What causes of death influenced the difference in life expectancy between the black and white populations in 2010?
- What causes of death influenced the difference in life expectancy between black and white males in 2010?
- What causes of death influenced the difference in life expectancy between black and white females in 2010?
- Summary
- Definitions
- Data source and methods
- About the authors
- References
- Suggested citation
 (754 KB)
Kenneth D. Kochanek, M.A.; Elizabeth Arias, Ph.D.; and Robert N. Anderson, Ph.D.
Key findings
Data from the National Vital Statistics System, Mortality- In 2010, life expectancy for the black population was 3.8 years lower than that of the white population. This difference was due to higher death rates for the black population for heart disease, cancer, homicide, diabetes, and perinatal conditions.
- Life expectancy for black males was 4.7 years lower than that of white males. This difference was due to higher death rates for black males for heart disease, homicide, cancer, stroke, and perinatal conditions.
- Life expectancy for black females was 3.3 years lower than that of white females. This difference was due to higher death rates for black females for heart disease, cancer, diabetes, perinatal conditions, and stroke.
Keywords: mortality, disparities, National Vital Statistics System
What are the current trends in life expectancy?
Life expectancy at birth increased from 70.8 years in 1970 to 78.7 years in 2010 for the total population (an 11% increase) (Figure 1). For white persons, the increase was from 71.7 years to 78.9 years (10% increase), and for black persons from 64.1 years to 75.1 years (17% increase). The gap in life expectancy between the white and black populations has decreased, from 7.6 years in 1970 to 3.8 years in 2010, but the disparity still exists.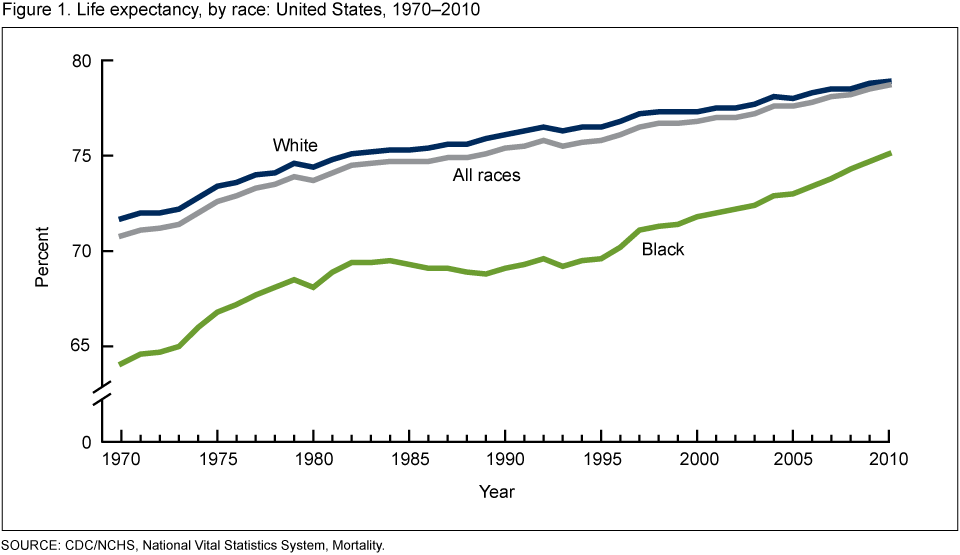
SOURCE: CDC/NCHS, National Vital Statistics System, Mortality.
How does life expectancy differ by race and sex?
The U.S. life expectancy at birth in 2010 was 78.7 years. Among the major race-sex groups, white females continued to have the highest life expectancy at birth (81.3 years), followed by black females (78.0 years), white males (76.5 years), and black males (71.8 years) (Figure 2) (1).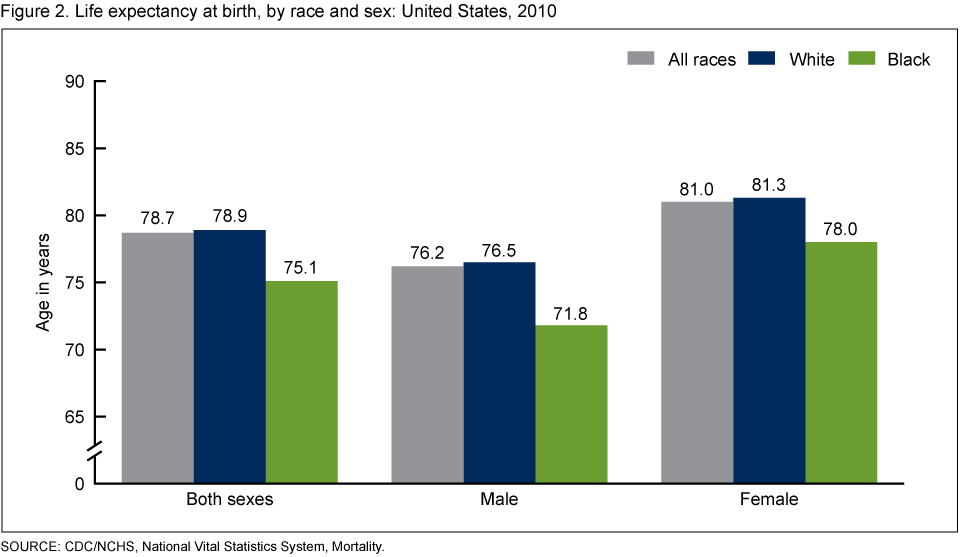
SOURCE: CDC/NCHS, National Vital Statistics System, Mortality.
What causes of death influenced the difference in life expectancy between the black and white populations in 2010?
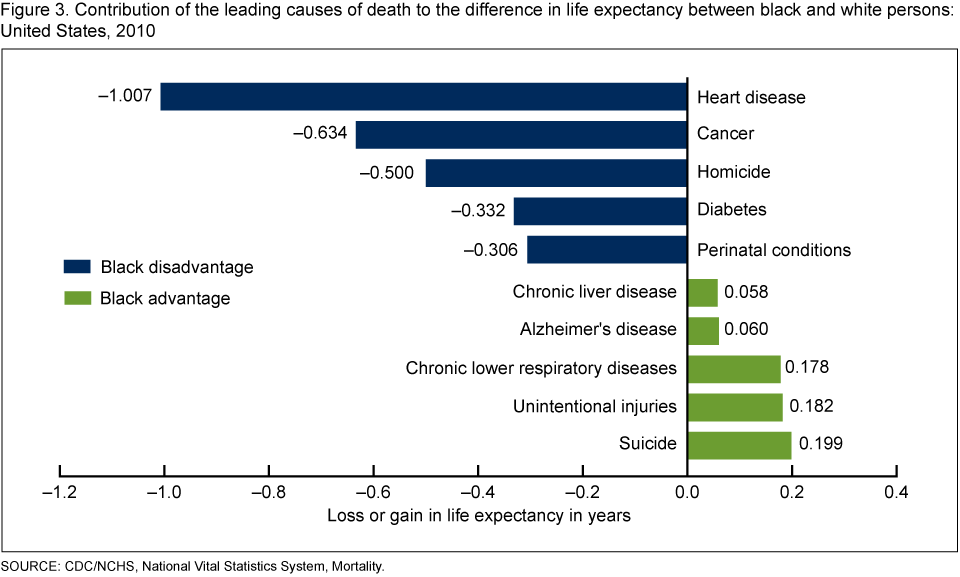
- Life expectancy for the black population was lower (3.8 years) than life expectancy for the white population because of higher death rates due to heart disease, cancer, homicide, diabetes, and perinatal conditions (Figure 3), which accounted for 60% of the black population disadvantage. Higher heart disease mortality for the black population accounted for a loss of 1.007 years in life expectancy.
- The difference was reduced somewhat by lower death rates due to suicide; unintentional injuries; Chronic lower respiratory diseases (chronic bronchitis, emphysema, COPD, and asthma); Alzheimer's disease; and Chronic liver disease, which accounted for 91% of the black population advantage in life expectancy.
- The black disadvantage outweighed any advantages with respect to the diseases listed in Figure 3.
Figure 3. Contribution of the leading causes of death to the difference in life expectancy between black and white persons: United States, 2010
SOURCE: CDC/NCHS, National Vital Statistics System, Mortality.
What causes of death influenced the difference in life expectancy between black and white males in 2010?
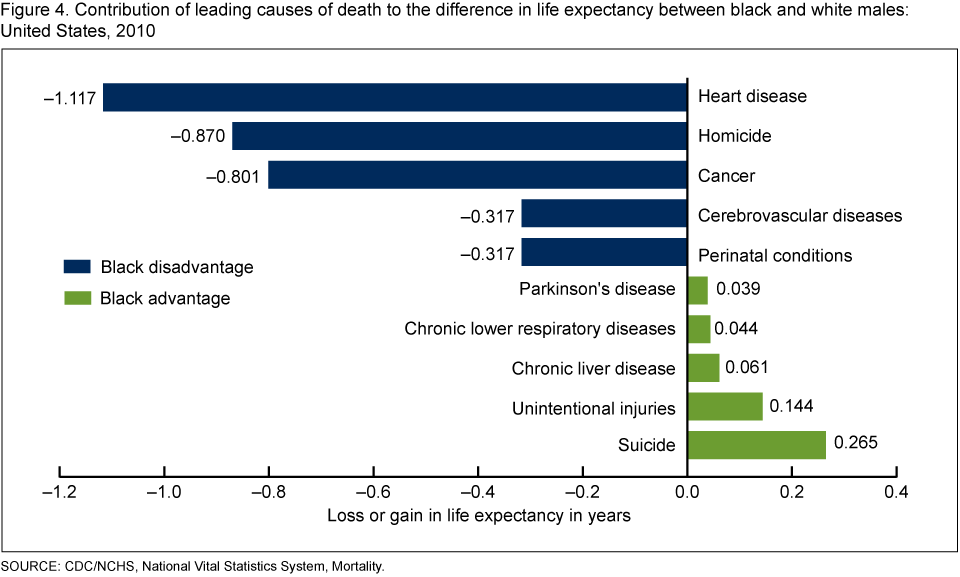
- Black male life expectancy was 4.7 years lower than that for white males.
- Higher death rates for black males due to heart disease, homicide, cancer, stroke, and perinatal conditions accounted for 65% of the black male disadvantage (Figure 4).
- Heart disease accounted for a loss of 1.117 years in life expectancy for black males.
- Lower death rates for black males due to suicide, unintentional injuries, Chronic liver disease, Chronic lower respiratory diseases, and Parkinson's disease accounted for 96% of the black male advantage.
Figure 4. Contribution of leading causes of death to the difference in life expectancy between black and white males: United States, 2010
SOURCE: CDC/NCHS, National Vital Statistics System, Mortality.
What causes of death influenced the difference in life expectancy between black and white females in 2010?
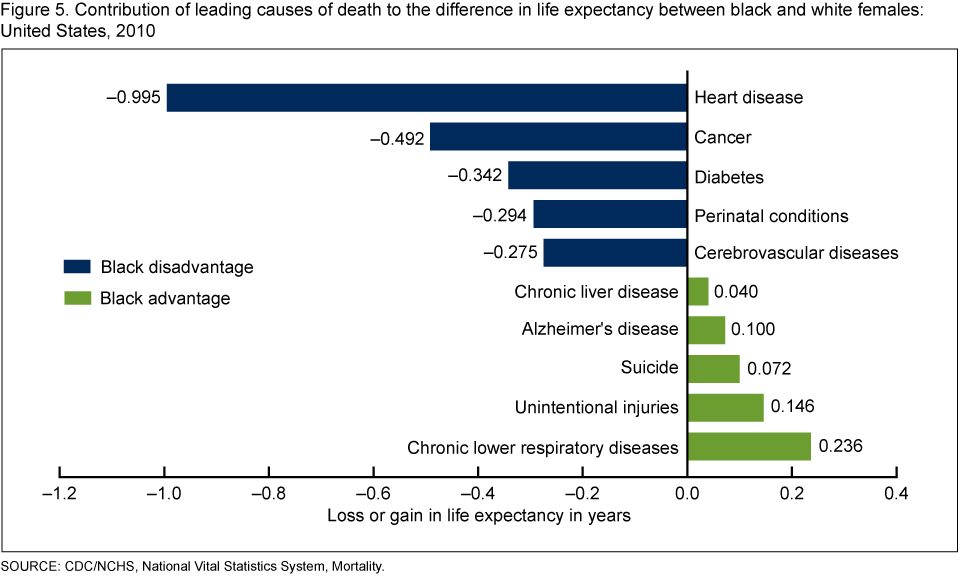
- Black female life expectancy was 3.3 years lower than that for the white females.
- Higher death rates for black females due to heart disease, cancer, diabetes, perinatal conditions, and stroke accounted for 61% of the black female disadvantage (Figure 5).
- Heart disease accounted for a loss of 0.995 years in life expectancy for black females.
- Lower death rates for black females due to Chronic lower respiratory diseases, unintentional injuries, suicide, Alzheimer's disease, and Chronic liver disease accounted for 93% of the black female advantage.
Figure 5. Contribution of leading causes of death to the difference in life expectancy between black and white females: United States, 2010
SOURCE: CDC/NCHS, National Vital Statistics System, Mortality.
Summary
Life expectancy at birth has increased steadily to a record high 78.7 years in 2010. But differences between the white and black populations still exist, with a gap in life expectancy of 3.8 years. These disparities in life expectancy at birth between the black and white populations can be examined to determine which leading causes of death contribute most to the differences.In 2010, life expectancy for the black population was lower than for the white population, mostly due to disparities in death rates from heart disease, cancer, and homicide. Similarly, the differences between black and white male life expectancy (4.7 years) were due to disparities in death rates from heart disease, homicide, and cancer. For black females, diabetes is added to heart disease and cancer as the major causes contributing to the differences in life expectancy (3.3 years) compared with white females.
The gap in life expectancy between the white and black populations would have been larger than 3.8 years if not for the lower death rates for the black population for suicide, unintentional injuries, and Chronic lower respiratory diseases. These causes show a black advantage by decreasing the gap in life expectancy. Without the advantage of these three causes of death, the gap in life expectancy would increase to 4.4 years. For black males, the causes that show an advantage over white males were suicide, unintentional injuries, and Chronic liver disease, while the advantageous causes for black females were the same as the causes for the black population.
This report is the first in a series to explore the causes of death contributing to differences in life expectancy between detailed ethnic and racial populations in the United States.
Definitions
Cause-of-death classification: Medical information—including injury diagnoses and external causes of injury—that is entered on death certificates filed in the United States, and is classified and coded in accordance with the International Statistical Classification of Diseases and Related Health Problems, Tenth Revision (ICD–10) (3). Corresponding cause-of-death categories and ICD–10 codes presented in this report are as follows:- Heart disease [Diseases of heart (I00–I09,I11,I13,I20–I51)]
- Cancer [Malignant neoplasms (C00–C97)]
- Stroke [Cerebrovascular diseases (I60–I69)]
- Chronic lower respiratory diseases (J40–J47)
- Unintentional injuries [Accidents (V01–X59,Y85–Y86)]
- Alzheimer's disease (G30)
- Diabetes [Diabetes mellitus (E10–E14)]
- Suicide [Intentional self-harm (*U03,X60–X84,Y87.0)]
- Chronic liver disease [Chronic liver disease and cirrhosis (K70,K73–K74)]
- Parkinson's disease (G20–G21)
- Homicide [Assault (*U01–*U02,X85–Y09,Y87.1)]
- Perinatal conditions [Certain conditions originating in the perinatal period (P00–P96)]
- HIV disease [Human immunodeficiency virus (HIV) disease (B20–B24)]
Data source and methods
All data are from the 2010 mortality file from the National Vital Statistics System. Life table methodology is explained in the reports "Deaths: Final Data for 2010" (1) and "United States Life Tables, 2008" (4). A complete description of the Arriaga life table partitioning methodology can be found in references 5 and 6.About the authors
Kenneth D. Kochanek, Elizabeth Arias, and Robert N. Anderson are with the Centers for Disease Control and Prevention's National Center for Health Statistics, Division of Vital Statistics, Mortality Statistics Branch.References
- Murphy SL, Xu JQ, Kochanek KD. Deaths: Final data for 2010. National vital statistics reports; vol 61 no 4. Hyattsville, MD: National Center for Health Statistics. 2013.
- HHS. Phase I Report: Recommendations for the framework and format of Healthy People 2020, Appendix 11
. Measuring health disparities and health equity. 2008.
- WHO. International statistical classification of diseases and related health problems, tenth revision (ICD–10). 2nd ed. Geneva, Switzerland. 2004.
- Arias E. United States life tables, 2008. National vital statistics reports; vol 61 no 3. Hyattsville, MD: National Center for Health Statistics. 2012.
- Arriaga E. Measuring and explaining the change in life expectancies. Demography 21(1):83–96. 1984.
- Arriaga E. Changing trends in mortality decline during the last decades. In: Ruzicka LT, Wunsch GJ, Kane P, (eds.). Differential mortality: Methodological issues and biosocial factors. New York: Oxford University Press Inc. 1989.
Suggested citation
Kochanek KD, Arias E, Anderson RN. How did cause of death contribute to racial differences in life expectancy in the United States in 2010? NCHS data brief, no 125. Hyattsville, MD: National Center for Health Statistics. 2013.Copyright information
All material appearing in this report is in the public domain and may be reproduced or copied without permission; citation as to source, however, is appreciated.National Center for Health Statistics
Charles J. Rothwell, M.S., Acting DirectorJennifer H. Madans, Ph.D., Associate Director for Science


.png)


No hay comentarios:
Publicar un comentario