|

Volume 25, Number 6—June 2019
Research
Enhancement of Risk for Lyme Disease by Landscape Connectivity, New York, New York, USA
Podcast
Altmetric
Meredith C. VanAcker , Eliza A.H. Little, Goudarz Molaei, Waheed I. Bajwa, and Maria A. Diuk-Wasser
Abstract
Most tickborne disease studies in the United States are conducted in low-intensity residential development and forested areas, leaving much unknown about urban infection risks. To understand Lyme disease risk in New York, New York, USA, we conducted tick surveys in 24 parks throughout all 5 boroughs and assessed how park connectivity and landscape composition contribute to Ixodes scapularis tick nymphal densities and Borrelia burgdorferi infection. We used circuit theory models to determine how parks differentially maintain landscape connectivity for white-tailed deer, the reproductive host for I. scapularis ticks. We found forested parks with vegetated buffers and increased connectivity had higher nymph densities, and the degree of park connectivity strongly determined B. burgdorferi nymphal infection prevalence. Our study challenges the perspective that tickborne disease risk is restricted to suburban and natural settings and emphasizes the need to understand how green space design affects vector and host communities in areas of emerging urban tickborne disease.
Lyme disease, or Lyme borreliosis, is the most commonly reported arthropodborne disease in the United States and Europe (1). In the eastern United States, this disease is caused by Borrelia burgdorferi sensu stricto (hereafter B. burgdorferi), a spirochete transmitted by the blacklegged tick, Ixodes scapularis, and maintained in a horizontal transmission cycle between larval and nymphal I. scapularis ticks and a vertebrate reservoir host community (2). I. scapularis ticks vector 6 other tickborne pathogens, including Babesia microti (the cause of human babesiosis) and Anaplasma phagocytophilum (the cause of human granulocytic anaplasmosis). The geographic expansion of these pathogens has followed the spread of their shared vector across the northeastern and midwestern United States over the past 50 years (3). The range expansion of I. scapularis ticks is attributed to reforestation (4), the increase in deer populations (4), and climate-facilitated expansion (5). Although historically associated with the incursion of suburban and exurban development into rural areas (4), tickborne diseases are an emerging urban threat, indicated by an unprecedented increase in locally acquired cases in New York City (NYC), NY, USA (6), and B. burgdorferi–infected I. scapularis in Chicago, IL, USA (7). In contrast with several European studies on urban Lyme borreliosis (8), the risk for acquiring B. burgdorferi infection in US cities is unknown.
As tickborne diseases spread into urban areas, key issues are what ecologic and sociobehavioral conditions enable establishment of the enzootic cycle and pathogen spillover to humans. Landscape modification, such as forest fragmentation (breaking up of large continuous forests into smaller patches), has been linked to increased transmission risk for Lyme disease (9,10). Forest fragmentation increases edge habitat and might reduce host biodiversity by increasing densities of white-footed mice (Peromyscus leucopus), a major host for immature I. scapularis ticks and B. burgdorferi, relative to less competent hosts. Fragmentation might also favor white-tailed deer (Odocoileus virginianus) (hereafter deer), the reproductive host for adult I. scapularis ticks, through increased forage quality and predator release (9,10), and might bring humans in closer contact with forests and tick vectors, increasing human–tick contact rates (10). However, extreme fragmentation of suitable habitat patches within an impermeable urban matrix might decrease disease risk if connectivity is reduced to the point of limiting host and tick movement (11). This connectivity might be partially restored by establishing green spaces and habitat corridors within cities, which can lead to an introduction of tick populations and pathogens into new areas (7,12,13).
With high human densities in cities, emerging tickborne infections can cause a major public health burden (12). Human risk for acquiring Lyme disease is dependent on the density and infection prevalence of nymphal I. scapularis ticks, the hazard, or potential source of harm (14). Thus, understanding the drivers of vector and pathogen distribution is critical for designing effective intervention strategies. Because of increasing incidence of locally acquired Lyme disease cases on Staten Island (6), a borough of NYC, and the potential for expansion to other boroughs, we sought to determine the hazard posed by I. scapularis ticks in public parks in NYC, and characterize the effect of landscape composition and connectivity in and around parks on nymphal I. scapularis tick densities and B. burgdorferi infection prevalence.
Site Selection
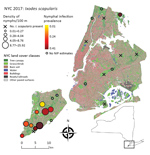
Figure 1. Study area for analysis of Ixodes scapularis nymphal tick densities and Borrelia burgdorferiinfection prevalence, New York, New York, USA, 2017. Open circles indicate parks where tick sample size was too...
We surveyed 24 public parks in NYC (Figure 1; Table 1): 13 on Staten Island, 2 in Manhattan, 2 in Brooklyn, 3 in the Bronx, and 4 in Queens. Fifteen of these parks are included in ongoing tick surveillance by the NYC Department of Health and Mental Hygiene. The inclusion criteria we used to select the parks were location (representing all 5 boroughs), size (26–794 ha), and forest area (7–433 ha) gradients.
Nymphal Tick Collection
We performed tick collections under a City of New York Parks and Recreation research permit and a New York State Department of Environmental Conservation license to collect. We surveyed parks twice, with a minimum of 2 weeks separation, during the nymphal activity peak (15) of May 30–June 30, 2017 (Table 1). All tick collections were conducted by the same 2 persons. We scaled transect coverage by the park area and restricted transects to continuous forest patches that were large enough to complete 100-m transects (Appendix Table 1). Within each park, we divided the effort by 50% along trail/forest edge and 50% perpendicular to the trail into interior forest. We collected ticks every 20 m along the transects by dragging a 1 m2 white corduroy cloth (16), then removed ticks with forceps, placed them in vials containing 100% ethanol, and identified them to species and life stage by using a standard key (17). We recorded global positioning system waypoints at the beginning of each transect and every 20 m. Surveys were not conducted on days with rain.
Screening of I. scapularis Ticks for Infection with B. burgdorferi
We screened ≈50 nymphal ticks for B. burgdorferi infection in each park (with 1 exception, Bloomingdale Park [n = 39]). We considered this screening conservative because we estimated that >10 ticks should be screened to be 95% confident the site is negative for B. burgdorferi if the expected infection prevalence is 26.6%. We homogenized ticks and extracted genomic DNA by using the DNeasy Blood and Tissue Kit (QIAGEN, ) or DNA-zol BD (Molecular Research Center, ) according to the manufacturers’ recommendations with modifications (18). We used PCRs to screen for infection with B. burgdorferi by using primer sets for flagellin (19), 16S rRNA (20), and outer surface protein A (21) genes (thermocycling conditions provided in the Appendix). DNA isolated from B. burgdorferi strain 2591 culture and from uninfected laboratory-reared ticks were used as positive and negative controls in all PCRs. We identified positive samples by their band size and sequenced amplicon subsamples to confirm the genetic product identity.
Landscape Analyses
Land Cover Layers
We used a high-resolution (1 m × 1 m) land cover dataset for NYC derived from 2010 Light Detection and Ranging () data and 2008 4-band orthoimagery. Data were classified by using a rule-based expert system into 7 land cover classes: tree canopy, grass/shrub, bare soil, water, buildings, roads, and other paved surfaces (22). We combined buildings, roads, and paved surfaces into 1 impervious surface land cover class. We extracted the 24 park polygons from the NYC Open Spaces file (23) and quantified the park area and forest area within each park.
Land Cover Composition Surrounding Parks
We used buffering, a geographic information system procedure, to extract the proportion of each land cover class within a fixed width area surrounding the park boundaries, excluding coastal waterways. To assess the most predictive buffer size, we calculated the percentage of each land cover class (tree canopy, grass, soil, water, and impervious surfaces) for 5 buffer widths spaced every 100 m from 100 through 500 m. We used the buffer surrounding the park edge as a predictor of I. scapularis tick density within the park to indicate the accessibility of the park to hosts carrying feeding ticks or the pathogen.
Landscape Connectivity Metrics
For parks in all boroughs, we calculated the Euclidean distance between each pair of park centroids. We set all values in the distance matrix >4.8 km to 0 (distance threshold; i.e., all parks that were >4.8 km were considered unconnected); all park pairs <4.8 km were set to 1. This threshold is based on the average deer movement on Staten Island of 4.0–4.8 km (24) and the assumption that new tick populations are established from female adult ticks dropping off of deer. We used the total number of connections between park pairs according to the distance threshold as a model covariate.
We conducted connectivity analyses based on circuit theory only for Staten Island because this borough had a large number of established tick populations with variable densities among parks. We calculated a metric called flow centrality by using the programs Circuitscape (25), Linkage Mapper, and Centrality Mapper to assess the importance of each sampled park in maintaining connectivity across the island for deer, ticks, and pathogens (Appendix). We considered the outline of the parks as nodes, or the population sources, and the remaining raster pixels as the matrix. We assigned resistance values to each land cover class in the matrix according to its resistance to deer movement (26–28) and gene flow (29). Although focusing on deer, the resistance values broadly represented connectivity for other known host species of I. scapularis ticks and B. burgdorferi (Appendix Table 2). We applied Linkage Mapper (30), which uses parameters from Circuitscape to identify the least cost paths (LCPs), the single best path of lowest resistance that an animal may use to move through the matrix. We used the LCP network in Centrality Mapper, which assigns each link between nodes a resistance equivalent to the cost-weighted distance of the corresponding LCP. Centrality Mapper applies 1 amp of current into a pair of nodes, iterating through each possible pair of nodes, to calculate the flow centrality score or the current sum across all nodes and connections. Flow centrality is a measure of the contribution of a park to maintaining network connectivity on Staten Island and was used as a covariate in tick density and infection prevalence models.
Model Development
Covariate Standardization and Buffer Size Selection
We developed 1 model to examine the presence of I. scapularis ticks in parks across all NYC boroughs and 2 models with only Staten Island data to determine the best predictors of I. scapularis tick density and nymphal infection prevalence. We standardized all landscape covariates used in the 3 models by subtracting the mean and dividing by 1 SD. To determine the most predictive buffer size of I. scapularisnymphs, we ran univariate negative binomial generalized linear models (GLMs; glm.nb in the MASS package [31] in R [32]) for all land cover buffer sizes. We included an offset term, the natural log of the total transect length in a given park, to account for sampling effort. We compared the univariate models of the 5 buffer sizes for each land cover class by using the Akaike Information Criterion (AIC) scores (33) and retained the buffer size with the lowest AIC for future analyses (Appendix Table 3).
Model Selection
We used GLMs (binomial and negative binomial families) without interactions or random effects to examine the NYC-wide and Staten Island data. For all global models, we assessed multicolinearity between the covariates by using the variance inflation factor (VIF) (34) and retained covariates for each final analysis that had a VIF score <4 (34). We used an information theoretic approach (33) and AIC for small sample sizes (AICc) to identify the best-fitting models describing presence, density, and infection prevalence of I. scapularis ticks. We used multimodel inference, which uses model averaging (MuMIn package [35] in R [32]) to include information from competing models that significantly explain the data. The averaged model is based on a subset of models within 95% of the cumulative AIC weights. The relative importance (RI) of each covariate ranges from 0 through 1 and describes the sum of the Akaike weights in each model in which the covariate is present. If there were no closely competing models (within ∆AIC <2 from the lowest AICc score), we did not use model averaging and selected the final candidate model with the lowest AICc score. We evaluated model fit with McFadden R2 (36) for logistic regression models and assessed the root mean squared error (RMSE) for the negative binomial model. We included the same offset term as above in all models.
I. scapularis Nymphs in NYC
We used a binomial GLM to examine drivers of presence of I. scapularis ticks at parks throughout the 5 boroughs. We considered established parks those where >6 ticks were collected during 2 surveys. This threshold was used by Dennis et al. (37) and Eisen et al. (38) to classify US counties and was meant to distinguish reproductive tick populations from individual immature ticks that might have detached from a bird. Covariates used to model tick presence were tree canopy area within the park (square meters); the number of connections to other parks within 4.8 km (range 0–5 connections); and the land cover composition of the park buffers, including tree canopy, impervious surfaces, water, grass/shrub (percentage within 100 m of park edge), and soil (percentage within 300 m of park edge).
Density of I. scapularis Nymphs on Staten Island, NY

Figure 2. Current centrality for parks and linkages on Staten Island, New York, USA, 2017. In connectivity analysis, the park outlines were used as nodes, and gray indicates the matrix used for the...
We used a negative binomial GLM to examine relationships between landscape metrics and tick density (nymphal count/transect length). The negative binomial error structure was selected by using a likelihood ratio test that compared the fit with a poisson error structure. The covariates included in the models were the same as the presence/absence model for NYC, with the addition of the flow centrality scores (range 14.9–41.3) (Figure 2). We examined the global spatial autocorrelation of residuals from the tick density regression model by using a Moran's I test (39).
Prevalence of I. scapularis Nymphs Infected with B. burgdorferi on Staten Island
We used a binomial GLM model to assess the best covariates to predict the nymphal infection prevalence (NIP) at 9 parks on Staten Island. The covariates included in the models were the same as those used in the nymphal density model for Staten Island in addition to the density of nymphs.
Buffer Size Selection
The coefficient signs stayed constant for all buffer sizes within the same land cover class in the univariate GLMs (Appendix Table 3). All models examining percentage of tree canopy in the buffer showed a positive effect on tick density; all models that included percentage of grass, soil, water, and impervious surfaces in the buffer had negative effects on tick density. A buffer size of 100 m was the best fit for all land cover classes except bare soil, for which a 300 m buffer had the lowest AIC (Appendix Table 3).
I. scapularis Ticks in NYC
At least 1 I. scapularis nymph was found at 17 of 24 parks surveyed throughout NYC. Of these parks, 10 had >6 nymphs and were categorized as established for I. scapularis populations; all of these sites were on Staten Island, except for Pelham Bay Park in the Bronx (Table 1). The model with the lowest AIC included the number of connections a park had to surrounding parks within 4.8 km (p = 0.005) (Appendix Figure 1). This model explained moderate levels of variation with a McFadden R2 of 0.38.
Density of I. scapularis Ticks on Staten Island
Because 9 of 10 parks with established tick populations were on Staten Island, we limited the analysis of I. scapularis density to this borough. Blacklegged ticks were most abundant in the central and southern regions of the island (Figure 1). We removed 1 covariate that had a VIF >4, percentage of grass in the buffer. We identified 4 multivariate models with considerable support (∆AIC <2), these were within 95% of the cumulative AIC weights that composed the averaged model. Flow centrality, percentage tree canopy, soil, and water within the buffer were the major covariates (RI = 1.00) and were present in all 4 models comprising the averaged model (Table 2; Appendix Table 4). The percentagew impervious surfaces within a 100-m buffer (RI = 0.36) and the tree canopy area within the park (RI = 0.65) showed no major effect on I. scapularis tick density (CIs include 0) in the averaged model, although tree canopy area showed major positive effects in a subset of models that comprised the averaged model. The RMSE of the model residuals was 1.04; a total of 64.8% of the values fell within 1 RMSE and 98.9% of the values fell within 2 RMSE. Residuals from the regression model were not spatially autocorrelated according to the Moran's I test results (p = 0.09), indicating the tick surveys can be considered independent.
Prevalence of I. scapularis Nymphs Infected with B. burgdorferi on Staten Island
We estimated NIP for 9 parks on Staten Island and 1 park in the Bronx (Table 3). A total of 8%–40% of ticks tested at each site were positive for B. burgdorferi (Table 3; Figure 1), and the average NIP across all sites was 26.6% (149/560) positive for B. burgdorferi.

Figure 3. Ixodes scapularis tick nymphal infection prevalence and flow centrality model for Staten Island, New York, USA, 2017. The centrality score of 9 parks was the best predictor for nymphal infection prevalence....
We assessed the VIF of the global model limited to the NIP for Staten Island and removed 2 covariates with VIF scores >4, percentage of tree canopy within a 100-m buffer, and density of nymphs. The univariate model with flow centrality had a model weight of 0.45, and no other model combinations were within <2 ∆AIC from the lowest AIC. Therefore, we did not apply model averaging and determined that flow centrality was the significant factor (p = 0.009) in predicting NIP at parks on Staten Island (Figure 3). The McFadden R2for this model showed low explained variation (R2 = 0.13), likely caused by small sample size.
We examined how urban landscape composition and configuration reflects the environmental and ecologic conditions driving the distribution of ticks and their pathogens. We found the distance between urban parks best explained whether I. scapularis ticks were present and that flow centrality of parks, an indicator of the connectivity of parks for deer and other hosts, had the largest positive effect on the density and infection prevalence of I. scapularis nymphs. Covariates that describe the composition of the landscape surrounding each park also had a major positive (percentage tree canopy) or negative (percentage water and soil) effect on the densities of I. scapularisnymphs.
Environmental conditions can limit I. scapularis tick population establishment and persistence. The negative effect of bare soil surrounding parks might reflect deer aversion to open habitats and tick physiology. To prevent desiccation, ticks seek microclimates that have higher ambient humidity (40). Ticks achieve water replenishment when they descend to lower vegetation layers (40), often leaf litter. Without vegetation, ticks might quickly desiccate when dropped in bare soil. Furthermore, the amount of water surrounding the park negatively affected I. scapularis tick density, suggesting that water might also serve as a barrier for deer movement into particular parks and could limit tick population persistence. Our findings are consistent with studies that have found agricultural fields, large urbanized areas (27), and a combination of landscape features with low permeability, such as waterways and roads, to impede deer movement (29), potentially slowing tick expansion.
The introduction of I. scapularis ticks into new habitats can occur through multiple pathways. Because these ticks move only a few meters during each life stage, host movement and habitat use during tick feeding determine dispersal patterns (41). Landscape structure and connectivity might differentially affect reservoir (rodents, medium-size mammals, and birds) and reproductive host (deer) movement. Adult I. scapularis ticks are mainly distributed by deer (41); they serve as the primary host for adult ticks, and >90% of female I. scapularis ticks feed on deer (42). Although locally dispersing or migrating passerine birds play a role in moving immature ticks longer distances (43), deer are key hosts for establishing new populations locally because 1 female adult tick will lay ≈2,000 eggs after a successful blood meal from a deer (44). We were unable to sample larvae and adults; however, a previous study has shown a positive linear relationship between the density of larvae and nymphs (9). Without sufficient deer available, tick populations cannot be sustained or are sustained at much lower levels (42). The lack of deer reported in parks where we did not find established I. scapularis tick populations (45) indicates a strong link between deer and presence of I. scapularis ticks in NYC parks.
Landscape structure and connectivity also impacts the distribution and movement of small and medium-size mammals that are hosts for immature ticks and B. burgdorferi. Rodent hosts can contribute to a slower range expansion of B. burgdorferi and infected immature ticks (46). Rodent movement is determined by their ability to penetrate habitats, and sources of landscape resistance imposed on movement of white-footed mice, Eastern chipmunks, and red squirrel is similar between these host species (47).
Our results show that landscape composition and configuration have direct implications on urban Lyme disease risk. This finding is especially useful because >80% of persons in North America now reside in urban centers (48), the distribution of I. scapularis ticks continues to expand (38), and interest is increasing in urban green space serving as a key moderator of poverty, health, health equity, and environmental justice (49). Initiatives that increase urban green space have clear benefits for human well-being, climate change mitigation, and wildlife conservation. However, our study calls attention to the need to understand the drivers of tick distribution and densities within urban green spaces in the United States. Our findings on the role of flow centrality in maintaining tick and pathogen populations indicate a potential nonlinear effect of forest fragmentation on tickborne disease risk by emphasizing that fragment connectivity is a neglected key factor (however, see reports by Mechai et al. [47] and McClure and Diuk-Wasser [50]). A better understanding of how landscape shapes host communities, their movement, and tick habitat in urban and suburban regions is critical to ameliorate the risk for tickborne diseases.
Ms. VanAcker is a doctoral student in the Department of Ecology, Evolution, and Environmental Biology at Columbia University, New York, NY. Her primary research interests include zoonotic infectious diseases, landscape ecology, wildlife conservation, and the use of next-generation sequencing for vectorborne diseases.
Acknowledgments
We thank our field assistant, Robert Carson, for providing research support and Alex Diaz, Mallery Breban, and Dasha Pokutnaya for providing technical assistance. We also thank the NYC Department of Parks and Recreation and the NYC Department of Health and Mental Hygiene for their contribution.
This study was supported by Cooperative Agreement No. U01CK000509-01 from the Centers for Disease Control and Prevention. M.A.D.-W. was supported by the National Institutes of Health, Ecology and Evolution of Infectious Disease Program (R01 GM105246). Robert Carson was funded by the Earth Institute.
References
- Steere AC, Coburn J, Glickstein L. The emergence of Lyme disease. J Clin Invest. 2004;113:1093–101.
- Diuk-Wasser MA, Hoen AG, Cislo P, Brinkerhoff R, Hamer SA, Rowland M, et al. Human risk of infection with Borrelia burgdorferi, the Lyme disease agent, in eastern United States. Am J Trop Med Hyg. 2012;86:320–7.
- Telford SR III, Goethert HK. Emerging tick-borne infections: rediscovered and better characterized, or truly ‘new’? Parasitology. 2004;129(Suppl):S301–27.
- Barbour AG, Fish D. The biological and social phenomenon of Lyme disease. Science. 1993;260:1610–6.
- Ogden NH, Bigras-Poulin M, Hanincová K, Maarouf A, O’Callaghan CJ, Kurtenbach K. Projected effects of climate change on tick phenology and fitness of pathogens transmitted by the North American tick Ixodes scapularis. J Theor Biol. 2008;254:621–32.
- Daskalakis DC. Department of Health and Mental Health. Advisory #14: tick-borne disease advisory. New York City, NY, 2017 [cited 2019 Jan 15].
- Hamer SA, Goldberg TL, Kitron UD, Brawn JD, Anderson TK, Loss SR, et al. Wild birds and urban ecology of ticks and tick-borne pathogens, Chicago, Illinois, USA, 2005-2010. Emerg Infect Dis. 2012;18:1589–95.
- Rizzoli A, Silaghi C, Obiegala A, Rudolf I, Hubálek Z, Földvári G, et al. Ixodes ricinus and its transmitted pathogens in urban and peri-urban areas in Europe: new hazards and relevance for public health. Front Public Health. 2014;2:251.
- Allan BF, Keesing F, Ostfeld RS. Effect of forest fragmentation on Lyme disease risk. Conserv Biol. 2003;17:267–72.
- Brownstein JS, Skelly DK, Holford TR, Fish D. Forest fragmentation predicts local scale heterogeneity of Lyme disease risk. Oecologia. 2005;146:469–75.
- Estrada-Peña A. Understanding the relationships between landscape connectivity and abundance of Ixodes ricinus ticks. Exp Appl Acarol. 2002;28:239–48.
- LaDeau SL, Allan BF, Leisnham PT, Levy MZ. The ecological foundations of transmission potential and vector-borne disease in urban landscapes. Funct Ecol. 2015;29:889–901.
- Uspensky I. Tick pests and vectors (Acari: Ixodoidea) in European towns: Introduction, persistence and management. Ticks Tick Borne Dis. 2014;5:41–7.
- Pepin KM, Eisen RJ, Mead PS, Piesman J, Fish D, Hoen AG, et al. Geographic variation in the relationship between human Lyme disease incidence and density of infected host-seeking Ixodes scapularis nymphs in the Eastern United States. Am J Trop Med Hyg. 2012;86:1062–71.
- Diuk-Wasser MA, Gatewood AG, Cortinas MR, Yaremych-Hamer S, Tsao J, Kitron U, et al. Spatiotemporal patterns of host-seeking Ixodes scapularis nymphs (Acari: Ixodidae) in the United States. J Med Entomol. 2006;43:166–76.
- Falco RC, Fish D. A comparison of methods for sampling the deer tick, Ixodes dammini, in a Lyme disease endemic area. Exp Appl Acarol. 1992;14:165–73.
- Clifford CM, Anastos G, Elbl A. The larval ixodid ticks of the eastern United States (Acarina-Ixodidae). Miscellaneous Publications of the Entomological Society of America. 1961;2:213–37.
- Molaei G, Andreadis TG, Armstrong PM, Anderson JF, Vossbrinck CR. Host feeding patterns of Culex mosquitoes and West Nile virus transmission, northeastern United States. Emerg Infect Dis. 2006;12:468–74.
- Barbour AG, Maupin GO, Teltow GJ, Carter CJ, Piesman J. Identification of an uncultivable Borrelia species in the hard tick Amblyomma americanum: possible agent of a Lyme disease-like illness. J Infect Dis. 1996;173:403–9.
- Gazumyan A, Schwartz JJ, Liveris D, Schwartz I. Sequence analysis of the ribosomal RNA operon of the Lyme disease spirochete, Borrelia burgdorferi. Gene. 1994;146:57–65.
- Persing DH, Telford SR III, Spielman A, Barthold SW. Detection of Borrelia burgdorferi infection in Ixodes dammini ticks with the polymerase chain reaction. J Clin Microbiol. 1990;28:566–72.
- University of Vermont Spatial Analysis Laboratory, NYC Urban Field Station. New York City Landcover 2010, 2012 [cited 2019 Jan 16].
- NYC Department of Information Technology and Telecommunications. NYC planimetric database, 2015 [cited 2019 Jan 15].
- DeNicola AJ. Staten Island deer research program final summary report. New York City, NY; 2017 [cited 2019 Jan 16].
- McRae BH, Dickson BG, Keitt TH, Shah VB. Using circuit theory to model connectivity in ecology, evolution, and conservation. Ecology. 2008;89:2712–24.
- Girardet X, Conruyt-Rogeon G, Foltête JC. Does regional landscape connectivity influence the location of roe deer roadkill hotspots?Eur J Wildl Res. 2015;61:731–42.
- Kelly AC, Mateus-Pinilla NE, Brown W, Ruiz MO, Douglas MR, Douglas ME, et al. Genetic assessment of environmental features that influence deer dispersal: implications for prion-infected populations. Popul Ecol. 2014;56:327–40.
- Long ES, Difenbach DR, Rosenberry CS, Wallingford BD, Grund MD. Forest cover influences dispersal distance of white-tailed deer. J Mammal. 2005;86:623–9.
- Coulon A, Guillot G, Cosson J-F, Angibault JM, Aulagnier S, Cargnelutti B, et al. Genetic structure is influenced by landscape features: empirical evidence from a roe deer population. Mol Ecol. 2006;15:1669–79.
- McRae B, Kavanagh D. Linkage mapper connectivity analysis software. Fort Collins (CO): The Nature Conservancy; 2011.
- Venables WN, Ripley BD. Modern applied statistics with S, 4th ed. New York: Springer; 2002.
- R Core Team. R: A language and environment for statistical computing. Vienna: R Foundation for Statistical Computing; 2017.
- Burnham KP, Anderson DR. Model selection and multimodel inference: a practical information-theoretic approach. New York: Springer; 2002.
- Fox J. Applied regression analysis and generalized linear models. Thousand Oaks (CA): Sage Publications; 2015.
- Bartoń K. MuMIn: multi-model inference, 2018 [cited 2019 Jan 15].
- McFadden D. Conditional logit analysis of qualitative choice behavior, 1973 [cited 2019 Jan 15].
- Dennis DT, Nekomoto TS, Victor JC, Paul WS, Piesman J. Reported distribution of Ixodes scapularis and Ixodes pacificus (Acari: Ixodidae) in the United States. J Med Entomol. 1998;35:629–38.
- Eisen RJ, Eisen L, Beard CB. County-scale distribution of Ixodes scapularis and Ixodes pacificus (Acari: Ixodidae) in the continental United States. J Med Entomol. 2016;53:349–86.
- Gittleman JL, Kot M. Adaptation: statistics and a null model for estimating phylogenetic effects. Syst Zool. 1990;39:227–41.
- Knulle W, Rudolph D. Humidity relationships and water balance of ticks. In: Obenchain FD, Galun R, editors. Physiology of ticks. Oxford (UK): Pergamon Press Ltd.; 1982. p. 43–70.
- Spielman A, Wilson ML, Levine JF, Piesman J. Ecology of Ixodes dammini-borne human babesiosis and Lyme disease. Annu Rev Entomol. 1985;30:439–60.
- Kilpatrick HJ, LaBonte AM, Stafford KC III. The relationship between deer density, tick abundance, and human cases of Lyme disease in a residential community. J Med Entomol. 2014;51:777–84.
- Ogden NH, Barker IK, Francis CM, Heagy A, Lindsay LR, Hobson KA. How far north are migrant birds transporting the tick Ixodes scapularis in Canada? Insights from stable hydrogen isotope analyses of feathers. Ticks Tick Borne Dis. 2015;6:715–20.
- Sonenshine DE, Roe MR, editors. Biology of ticks. New York: Oxford University Press; 2014.
- New York City Wildlife. White-tailed deer (Odocoileus virginianus), 2018 [cited 2018 Oct 14].
- Madhav NK, Brownstein JS, Tsao JI, Fish D. A dispersal model for the range expansion of blacklegged tick (Acari: Ixodidae). J Med Entomol. 2004;41:842–52.
- Mechai S, Margos G, Feil EJ, Lindsay LR, Michel P, Kotchi SO, et al. Evidence for an effect of landscape connectivity on Borrelia burgdorferi sensu stricto dispersion in a zone of range expansion. Ticks Tick Borne Dis. 2018;9:1407–15.
- United Nations. Department of Economic and Social Affairs PD, 2014. World urbanization prospects: the 2014 revision, highlights (ST/ESA/SER.A/352), 2014 [cited 2019 Jan 15].
- Jennings V, Baptiste AK, Osborne Jelks N, Skeete R. Urban green space and the pursuit of health equity in parts of the United States.Int J Environ Res Public Health. 2017;14:
E1432 . - McClure M, Diuk-Wasser M. Reconciling the entomological hazard and disease risk in the Lyme disease system. Int J Environ Res Public Health. 2018;15:1048.
Figures
Tables
Cite This ArticleOriginal Publication Date: 5/15/2019


.png)


.png)


No hay comentarios:
Publicar un comentario