The Burden of Vision Loss
Population Estimates
In 2015, a total of 1.02 million people were blind, and approximately 3.22 million people in the United States had vision impairment (VI), as defined by the best-corrected visual acuity in the better-seeing eye. In addition, 8.2 million people had VI due to uncorrected refractive error. By 2050, the numbers of these conditions are projected to double to approximately 2.01 million people who are blind, or having VI of 20/200 or worse, 6.95 million people with VI, and 16.4 million with VI due to uncorrected refractive error. (Varma 2015)
Through 2050, the number of people with VI are projected to continue to increase and remain higher among non-Hispanic white individuals compared with other racial/ethnic groups for both men and women. In 2050, the second highest number of VI cases is projected to shift from African American to Hispanic adults.
Figure 1. Estimated Numbers of Persons With Visual Impairment in the United States by Race/Ethnicity (All Persons) and Year
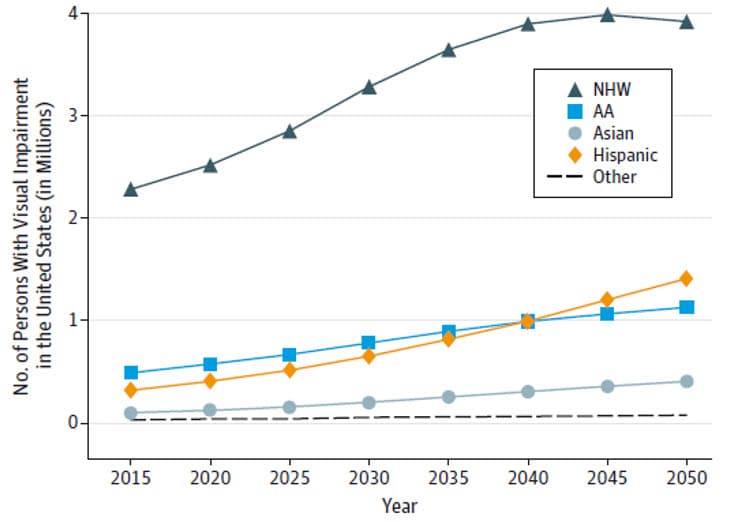
AA indicates African American; NHW, non-Hispanic white.
Source: Varma, et. al (2015)
Source: Varma, et. al (2015)
Vision Loss among Top Ten Disabilities
An analysis of the 1999 Survey of Income and Program Participation (CDC, 2001) revealed blindness or vision problems to be among the top 10 disabilities among adults aged 18 years and older. Vision loss has serious consequences for the individual as well as those who care for and about people who have compromised vision because it impedes the ability to read, drive, prepare meals, watch television, and attend to personal affairs. Reduced vision among mature adults has been shown to result in social isolation, family stress, and ultimately a greater tendency to experience other health conditions or die prematurely (Ellwein, Friedlin, McBean, & Lee, 1996).
Figure 2.

Source: Centers for Disease Control and Prevention. Prevalence of disabilities and associated health conditions among adults-United States, 1999. MMWR 2001; 50(7): 120-125.
Estimated Growth in Population
During the next three decades, the population of adults with vision impairment and age-related eye diseases is estimated to double because the rapidly aging U.S. population. In addition, the epidemic of diabetes as well as other chronic diseases will contribute to an increasing population of people who experience vision loss.
Table 1. Current Estimate and Projections of Prevalent Populations with Vision Problems
| Current Estimates | Projections | |||
| 2010 | 2014 | 2032 | 2050 | |
| Cataract | 24,409,978 | 25,666,427 | 38,477,608 | 45,620,606 |
| Diabetic Retinopathy | 7,685,237 | 8,084,767 | 10,938,504 | 13,190,538 |
| Impaired | 2,907,691 | 3,058,852 | 5,073,572 | 7,301,814 |
| Glaucoma | 2,719,379 | 2,858,572 | 4,275,758 | 5,526,347 |
| AMD* | 2,069,403 | 2,176,985 | 3,387,560 | 4,425,989 |
| Blind | 1,288,275 | 1,355,248 | 2,161,164 | 3,088,249 |
*Age-related macular degeneration
Source: Wittenborn, John S. & Rein, David B. The Future of Vision: Forecasting the Prevalence and Cost of Vision Problems. NORC at the University of Chicago. Prepared for Prevent Blindness, Chicago, IL. June 11, 2014.
http://forecasting.preventblindness.org.
References:
Bailey RN, Indian RW, Zhang X, Geiss LS, Duenas MR, & Saaddine JB. Visual impairment and eye care among older adults—five states, 2005. MMWR2006;55(49):1321–1325.
Eye Diseases Prevalence Research Group. Causes and prevalence of visual impairment among adults in the United States. Archives of Ophthalmology2004;122: 477–485.
Federal Interagency Forum on Aging-Related Statistics. Older Americans 2008: Key Indicators of Wellbeing[PDF – 3.3 MB]. Washington, DC: U.S. Government Printing Office 2008.
Pleis JR, Lethbridge-Çejku M. Summary health statistics for U.S. adults: National Health Interview Survey, 2006. National Center for Health Statistics. Vital Health Stat 2007;10(235).
Ellwein LB, Friedlin V, McBean AM, Lee PP. Use of eye care services among the 1991 Medicare population. Ophthalmology 1996;103:1732–1743.
Abstract
Abstract
Saaddine JB, Honeycutt AA, Venkat Narayan KM, Zhang X, Klein R, & Boyle, JP. (2008). Projection of diabetic retinopathy and other major eye diseases among people with diabetes mellitus. Archives of Ophthalmology 2008;126(12): 1740–1747.
Summary | Abstract
Summary | Abstract
Vajaranant, T. S., Burkemper, B., Wu, S., Torres, M., Hsu, C., … & McKean-Cowdin, R. (2016). Visual impairment and blindness in adults in the United States: Demographic and geographic variations from 2015 to 2050. JAMA ophthalmology, 134(7), 802-809.
Varma, R., Vajaranant, T. S., Burkemper, B., Wu, S., Torres, M., Hsu, C., … & McKean-Cowdin, R. (2016). Visual impairment and blindness in adults in the United States: Demographic and geographic variations from 2015 to 2050. JAMA ophthalmology, 134(7), 802-809.


.png)


.png)


No hay comentarios:
Publicar un comentario