| ||
| Download the PDF of the podcast transcript (34KB) | ||
| Dr. Alan Barrett, Professor and Vice Chair for Research, in the Department of Pathology of University of Texas, Medical Branch, discusses how bird migratory patterns affect West Nile virus outbreaks in the U.S. | ||
| Running time = 31:27 | ||
| Read the associated article in the December 2018 issue of the EID Journal Terrestrial Bird Migration and West Nile Virus Circulation, United States — D. Swetnam et al. |
Volume 24, Number 12—December 2018
Research
Terrestrial Bird Migration and West Nile Virus Circulation, United States
On This Page
Daniele Swetnam, Steven G. Widen, Thomas G. Wood, Martin Reyna, Lauren Wilkerson, Mustapha Debboun, Dreda A. Symonds, Daniel G. Mead, Barry J. Beaty, Hilda Guzman, Robert B. Tesh, and Alan D.T. Barrett
Abstract
Host migration and emerging pathogens are strongly associated, especially with regard to zoonotic diseases. West Nile virus (WNV), a mosquitoborne pathogen capable of causing severe, sometimes fatal, neuroinvasive disease in humans, is maintained in highly mobile avian hosts. Using phylogeographic approaches, we investigated the relationship between WNV circulation in the United States and the flight paths of terrestrial birds. We demonstrated southward migration of WNV in the eastern flyway and northward migration in the central flyway, which is consistent with the looped flight paths of many terrestrial birds. We also identified 3 optimal locations for targeted WNV surveillance campaigns in the United States—Illinois, New York, and Texas. These results illustrate the value of multidisciplinary approaches to surveillance of infectious diseases, especially zoonotic diseases.
West Nile virus (WNV) is a mosquitoborne virus that can cause severe and even fatal disease in humans. After WNV introduction into New York, NY, USA, its geographic range expanded quickly, reaching the West Coast in 2003. Previous studies have shown that the spread of WNV occurred faster than could be explained by contiguous diffusion (1–4) and demonstrated that its expansion occurred heterogeneously, consisting of contiguous diffusion and long distance translocations (2,5). Since then, phylogeographic studies have reported frequent mixing of WNV strains from local and distant locations. The most notable exception is California, where several genetic studies have shown limited movement into and out of the state (6,7).
The rapid expansion of WNV in the United States probably cannot be attributed to the movement of humans because humans are dead-end hosts. However, in nature, WNV is maintained in an enzootic transmission cycle involving mosquito vectors and highly mobile avian reservoirs. Hyalomma marginatum ticks have also been implicated in the transmission of WNV (8).
Although evidence of WNV infection has been identified in many species of birds, deaths and disease among birds vary greatly, ranging from asymptomatic to fatal infections; peak viremia potentially reaches >1012 PFU/mL (9). WNV RNA has been detected in bird spleen and kidneys as long as 36 weeks after infection (10) and in brains of Nestor notabilis kea up to 72 months after infection (11).
Although phylogenetic evidence of geographic clustering by location is limited, a recent study reported that WNV isolates clustered according to avian flyway (12). Because birds are the primary reservoirs for WNV, this finding was not surprising, but it is relevant because bird migration has also been implicated in the movement of influenza A virus (13), Borrelia burgdorferi (Lyme disease agent) (14), other pathogenic organisms (1), and even invasive invertebrate organisms (15). Several serologic studies (e.g., ELISA, plaque reduction neutralization test) have been used to determine the direction of WNV movement within the Atlantic, Mississippi, and Pacific flyways and demonstrated WNV in birds migrating southward, whereas evidence of the virus in birds during northward migration is limited (16,17).
Studies of virus movement associated with avian hosts in the United States have concentrated on the migration of waterfowl and excluded terrestrial birds, largely because the migratory patterns of waterfowl have been thoroughly characterized by banding studies. However, passerine birds, the primary reservoir for WNV, are terrestrial birds, not waterfowl. Terrestrial birds and waterfowl fly along similar but distinct flyways. Although waterfowl follow regular paths bounded by mountains and rivers, terrestrial birds often follow looped routes that enable them to maximize tail winds, avoid head winds, and correlate with seasonal fluctuations in food availability (18,19). Although looped migration paths have been described for several species of birds (Selasphorus rufus hummingbirds [20], Circus aeruginosus western marsh harriers [21], Falco eleonorae Eleonora’s falcons [22], Cuculus canoruscommon cuckoos [23]), the general flyways of terrestrial birds have been inadequately studied. However, in 2014, La Sorte et al. provided a general description of terrestrial bird flyways in North America (18). They defined 3 flyways: the single distinct Western flyway and 2 overlapping flyways, the Central and Eastern flyways. A similar 3-flyways system (Pacific, Central, and Atlantic flyways) has been described for waterfowl (24); however, most studies have relied on the more common 4-flyways system (Pacific, Central, Mississippi, and Atlantic flyways). In this study, we used phylogeographic approaches to investigate the relationship between WNV circulation in the United States and the flight paths of terrestrial birds.
Generation of Alignments
We identified all unique sequences of natural and laboratory WNV strains by using the Virus Variation Resource (25). Virus sequences meeting the following criteria were included in this study: 1) the nucleotide sequence spanned the complete open reading frame, 2) the sequence was derived from natural isolates and not laboratory strains, 3) the sequence was unique (i.e., all sequences differed by >1 nt), and 4) the sequence contained no degenerate nucleotides. All sequences were manually aligned in BioEdit version 7.1.3 (http://www.mbio.ncsu.edu/BioEdit/bioedit.html) or MEGA7 (https://www.megasoftware.net/), and noncoding regions were removed when necessary (i.e., the open reading frame was used for analyses).
Isolation of Viral RNA and Next-Generation Sequencing
We obtained additional WNV isolates from the World Reference Center for Emerging Viruses and Arboviruses at the University of Texas Medical Branch at Galveston (Galveston, TX, USA) (26). Isolates were originally collected from Virginia, Georgia, Texas, and Colorado. We extracted viral RNA from the supernatant of infected Vero cells by using a QIAamp Viral RNA Mini Kit (QIAGEN, Germantown, MD, USA) according to the manufacturer’s instructions. We generated libraries with a TruSeq RNA version 2 kit (Illumina, San Diego, CA, USA) and samples sequenced by the University of Texas Medical Branch at Galveston Next Generation Sequencing Core on an Illumina 1500 Hi-Seq platform. Adaptor sequences and poor quality reads (Q score <20) were removed with Trimmomatic (27). Reads were aligned with Bowtie2 (28) under the sensitive local parameter against the prototypical strain of WNV (NY99 flamingo 382–99, GenBank accession no. AF196835). Consensus sequences were generated by using SAMtools (29).
Phylogeny
To evaluate temporal structure, we generated a time-naive phylogeny (i.e., a maximum-likelihood phylogeny) to enable determination of the patristic distance between all isolates on the phylogeny. We generated maximum-likelihood trees with RAxML-HPC Black Box on Cyberinfrastructure for Phylogenetic Research version 3.3 (30) and determined automatic halting by bootstrapping. We determined the root-to-tip distance, which is a phylogenetic measure of genetic distance, for each isolate of the maximum-likelihood phylogenies by using TempEst (formerly Path-o-gen) (31). We evaluated the correlation (Pearson method) between root-to-tip distance and collection date in R (https://www.r-project.org/).
We used a Bayesian Markov chain Monte Carlo (MCMC) approach to infer phylogeographic relationships and selected the most appropriate phylogenetic model by using standard path sampling and stepping-stone approaches. XML files were generated in BEAUti version 1.8.3 or 1.8.4 and run with BEAST version 1.8.4 (32) on Cyberinfrastructure for Phylogenetic Research (30). We used the GTR+Γ+I (general time reversible with gamma rate distribution and invariable sites) model to infer nucleotide substitution frequencies, an uncorrelated lognormal clock model to infer the mutation rate, and a Bayesian Skyline tree prior to model changes in population size. The evolution rate mean was restricted to 10−4 through 9 × 10⁻⁴ substitutions/site/year, consistent with previously reported rates for WNV evolution (7,33).
We ran trees with an MCMC length of 100 million and sampled every 5,000 steps. Log files were reviewed in Tracer (http://tree.bio.ed.ac.uk/software/tracer/) to determine burn-in, which ranged from 5% through 10%. We ran multiple independent MCMC chains until effective sample size values exceeded 200. Log and tree files were combined in LogCombiner version 1.8, and a maximum clade credibility tree was generated in TreeAnnotator (32). Locations were inferred by using ancestral state reconstruction with an asymmetric discrete trait substitution model (34).
Analysis of Migration
After the XML files were generated in BEAUti, we manually edited them to enable counting of all Markov jumps (MJ) (which described the relative magnitude of migration out of source locations and into sink locations) for 2001 through 2009 (35). This method for evaluating migration, first described by Minin and Suchard (35), has been used to characterize migration of several major pathogens including rabies virus (36), dengue virus (37), HIV (38), influenza virus (39,40), and Rift Valley fever virus (41).
As expected for an emerging zoonotic disease, the annual West Nile neurologic disease (WNND) incidence and sample collection efforts varied dramatically among states over time, adding substantial complexity to the model. To mitigate the effects of inconsistent sampling and to confirm the observed results, we applied a stricter inclusion criterion to confirm the results obtained by using the full dataset. The sequences were randomly down-sampled such that the number of sequences used correlated (p<0.05 by Pearson method) with the incidence of WNND reported to the Centers for Disease Control and Prevention (CDC) in a particular year (the most accurate record of relative WNV activity). Our analysis ensured that the dataset was representative of the WNV activity of each region in a particular year.
We calculated incidence by using the number of WNND cases reported to CDC from each state during each year and dividing that number by the estimated population of each state. The population estimates were obtained from the Time Series of Intercensal State Population Estimates available at the Population Division of the US Census Bureau (42). States with insufficient sequences to represent the WNND incidence were excluded. Down-sampling was undertaken in at least duplicate to ensure that reduction in sample size and diversity did not remove important relationships.
Sequence Collection
All previously published sequences of natural WNV isolates collected in the United States were obtained from GenBank on January 1, 2016. The number of WNV sequences varied substantially over time and among locations, which presented statistical challenges. In particular, although GenBank has >900 WNV open reading frames, most come from a few states where laboratories were actively involved in WNV surveillance and research: California, New York, and Texas. The ability to compare multiple isolates over multiple years was critical to the analysis. Only a few states had sufficient numbers of WNV sequences available in GenBank to enable analysis for multiple consecutive years: New York, Connecticut, Illinois, North Dakota, South Dakota, Texas, and California.
To mitigate the influence of sampling bias, we obtained additional WNV isolates from the World Reference Center for Emerging Viruses and Arboviruses for 3 states and sequences to support the analysis: Virginia (n = 39), Georgia (n = 20), and Colorado (n = 31) (Table 1). Given that previous studies have demonstrated limited WNV movement into or out of California (6,7), we did not include isolates from California in the analysis. Similarly, because of the proximity of New York and Connecticut, we chose New York to represent WNV in the Northeast because Connecticut is a small state. Last, to ensure that each location was represented across a similar time frame, we included only isolates collected during 2001–2009 in the Bayesian phylogeny and migration analysis. Table 2 shows the states and availability of yearly isolates.
Model Selection
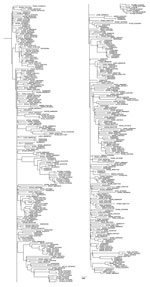
Figure 1. Maximum-likelihood phylogeny generated with all West Nile virus sequences from New York, Virginia, Georgia, Illinois, North Dakota, South Dakota, Texas, and Colorado (n = 379) in study of terrestrial bird migration...
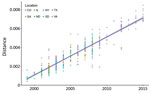
Figure 2. Analysis of correlation between virus isolation date and genetic diversity in study of terrestrial bird migration and West Nile virus circulation, United States. Root-to-tip distances of all sequences were determined for...
We compared 203 nucleotide substitution models by using the Bayesian and Akaike Information Criteria in JModelTest2 (https://github/com/ddariba/jmodeltest2) and found the GTR+Γ+I model to be the most appropriate. For assessing temporal signature, we used a maximum-likelihood tree with sequences of WNV strains from New York, Virginia, Georgia, Illinois, North Dakota, South Dakota, Texas, and Colorado (n = 379) (Figure 1). We identified a statistically significant positive correlation (r = 0.93, 95% highest posterior density [HPD] = 0.92–0.94; p<2.2 × 10⁻¹⁶) between the root-to-tip distance and the date of isolation in Temp-Est (formerly known as Path-O-gen) (Figure 2). The mutation rate was estimated to be 4.05 × 10⁻⁴ substitutions/site/year, and the most recent common ancestor (MRCA) was in 1997. Together these results indicated a strong temporal signal in the dataset. Finally, we evaluated Bayesian tree priors (skyride, skygrid, and skyline) and uncorrelated clock models (lognormal and exponential) by using path-sampling and stepping-stone approaches. The uncorrelated lognormal clock model with the Bayesian skyline tree prior was the most appropriate.
Phylogeographic Analysis for the United States
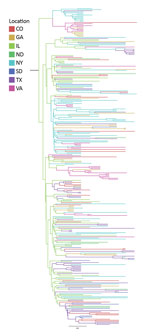
Figure 3. Bayesian phylogeny of West Nile virus isolates collected in representative regions along the Eastern and Central flyways between 2001 and 2009, United States. Maximum-clade credibility tree was obtained by using a...
Analysis of all WNV sequences collected from New York, Virginia, Georgia, Illinois, North Dakota, South Dakota, Texas, and Colorado during 2001–2009 provided estimates of the introduction date of the MRCA and mean evolution rate that were consistent with the estimates of the root-to-tip distance analysis (Table 3; Figure 3). The date of MRCA introduction was estimated as 1997, and the average evolution rate was 3.92 × 10⁻⁴ substitutions/site/year.
We used MJ between reconstructed ancestral states to estimate the magnitude of relative migration out of, or into, each of the 8 regions (Table 4, 5). Frequent migration (>2 MJ) was detected from Illinois to Colorado (8.38 MJ), Illinois to Georgia (8.23 MJ), Illinois to North Dakota (10.43 MJ), Illinois to New York (29.97 MJ), Illinois to South Dakota (6.69 MJ), Illinois to Texas (22.87 MJ), Illinois to Virginia (11.45 MJ), New York to Colorado (4.36 MJ), New York to Georgia (7.04 MJ), New York to South Dakota (2.18 MJ), New York to Texas (4.56 MJ), New York to Virginia (4.24 MJ), Texas to Colorado (9.78 MJ), Texas to North Dakota (5.18 MJ), Texas to South Dakota (7.56 MJ), and Virginia to Georgia (3.62 MJ).
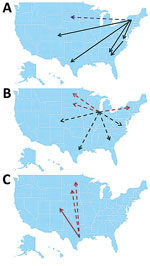
Figure 4. Summary of source/sink analysis in study of terrestrial bird migration and West Nile virus circulation, United States. Minimum number of migration events detected from A) the Eastern flyway, B) Illinois, and...
Overall, 3 major sources of WNV circulation (New York, Illinois, and Texas) seemed to be the origin of 88.5% of the total migration events observed (Table 4; Figure 4). Southward and westward movements were detected along the East Coast, but only northward movement was observed within the central United States. A notable exception was observed in Illinois, where evidence of WNV movement in all directions was demonstrated.
Incidence-Controlled Phylogeny
To mitigate the effects of inconsistent sampling, we applied a stricter inclusion criterion to ensure that the dataset was representative of WNV activity in each region in a particular year. In this approach, the sequences were randomly down-sampled by using the sample command in R, such that the number of sequences was proportional to the incidence of WNND reported to CDC (Table 6). Illinois, North Dakota, and South Dakota were not included in the down-sampled datasets because there were insufficient sequences to represent WNND incidence in these states. To ensure that reduction in sample size and diversity did not remove important relationships, the down-sampling was independently performed twice.
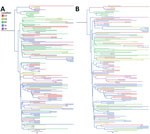
Figure 5. Incidence-controlled phylogeny of Eastern and Central flyways, United States. Sequences were down-sampled such that the number of sequences was proportional to the annual incidence of West Nile neurologic disease incidence for...
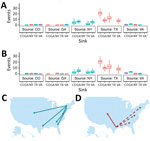
Figure 6. Summary of Markov jump analysis performed on the incident-controlled phylogeny. A, B) The results of the Markov jump analysis for each down-sampled dataset are summarized as box plots. Box tops indicate...
According to the 2 incidence-controlled datasets, the MRCA was ≈1997 in both down-sampling exercises (95% HPD 1996.00–1998.52 and 95% HPD 1995.7–1998.25), and the overall mutation rates were estimated to be 4.02 × 10⁻⁴ and 3.83 × 10⁻⁴ substitutions/site/year (Table 7; Figure 5). As with the full dataset, the Markov analysis demonstrated that New York and Texas were strong sources of WNV circulation. Significant movement (mean >2 MJ) was detected from Texas to Colorado (20.42 and 20.44 MJ); Texas to New York (12.36 and 11.77 MJ); Texas to Georgia (8.28 and 9.55 MJ); Texas to Virginia (7.14 and 7.732 MJ); New York to Georgia (6.1 and 5.38 MJ); New York to Virginia (4.95 and 3.65 MJ); New York to Colorado (4.04 and 2.66 MJ); New York to Texas (2.66 and 2.73 MJ); Virginia to Georgia (1.55 and 3.62 MJ); and, in dataset 2 only, Virginia to Colorado (1.31 MJ) (Figure 6).
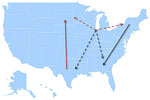
Figure 7. Model summarizing the general patterns of West Nile virus movement in the United States. Red, northward movement; teal, southward movement; dotted arrows, relationships that could not be confirmed in incident-controlled datasets...
Together, the MJ analyses of the incidence-controlled dataset and the full dataset illustrate a consistent pattern of WNV circulation. All southward movement originated in the eastern United States (New York and Virginia), and most of the northward movement originated in the central United States (Texas) (Figure 7).
In recent years, emerging zoonotic diseases caused by Ebola, Zika, Nipah, Middle Eastern respiratory syndrome, and influenza A viruses have become major public health problems, devastating communities and costing millions for public health interventions. Decisive, evidence-based approaches are critical for managing emerging infectious diseases, but effective and efficient countermeasures will be possible only after the relationships between pathogens and their hosts have been thoroughly characterized.
Bird migration has been implicated in the movement of a variety of pathogens (1). In particular, characterization of the relationship between avian influenza virus movement and waterfowl migration has supported surveillance and early warning programs (1,43). However, studies of avian hosts in the Americas have mainly concentrated on the migration of waterfowl to the exclusion of terrestrial birds because waterfowl are easily tracked with banding; thus, their migration has been thoroughly characterized.
The introduction and subsequent spread of WNV into the Americas underscores the invasive potential of emerging pathogens in the New World, as has been recently exemplified by Zika virus, another mosquitoborne flavivirus. Dramatic variations in the location, timing, and intensity of WNV strain collection and sequencing has left the field with a limited understanding of virus circulation patterns and no reliable way of predicting the geographic spread of WNV outbreaks. We have addressed this knowledge gap by characterizing the movement of WNV with regard to the migratory patterns of its natural hosts, terrestrial birds. We compiled 379 virus sequences for analysis, including 289 previously reported sequences from New York, Virginia, Georgia, Illinois, North Dakota, South Dakota, Texas, and Colorado, plus 90 novel sequences from Virginia, Georgia, and Colorado.
Phylogeographic analysis revealed that 3 locations— New York, Illinois, and Texas—accounted for 88.5% of the total WNV MJ inferred. Because New York is the presumed original introduction point for WNV into the United States, its role as a major source of WNV movement was expected. However, 74.2% of the observed MJ originated in Illinois and Texas only. Of note, North Dakota and South Dakota, which are 2 of the states with the highest annual WNND incidence, seem to be strong sinks for WNV moving out of Illinois and Texas.
The contributions of Illinois and Texas to WNV circulation are not surprising because both locations are situated at major convergence points between the Eastern and Central flyways. In the case of Texas, birds from both flyways may avoid long-distance flights across the Gulf of Mexico by traveling along the circa-Gulf route that follows the Gulf Coast through Texas into Mexico. In the case of Illinois, seasonal shifts in terrestrial bird migration routes ensure that Illinois supports birds from the Eastern and Central flyways during annual migrations.
Of note, although mosquito and WNV activity occurs earlier in the southern than in the northern United States, southward migration was detected along the East Coast during our sampling period, 2002–2009, indicating that the southeastern United States is probably a dead end for WNV circulation. Indeed, low-level transmission probably occurs during the winter in warmer locations such as Florida, Texas, and Louisiana. This possibility is supported by isolations of WNV from mosquitoes and birds during December and January in Harris County, Texas (44), and suggests that ecologic factors not related to mosquito abundance and WNV activity drive WNV movement along the East Coast. Instead, movement of WNV into the northeastern United States (New York) from Illinois and Texas was observed (in the incident-controlled analysis). These results suggest that introduction of WNV into the northeastern United States originated from the central United States.
Overall, we have defined the pattern of WNV circulation in the United States (Figure 7) and demonstrated looped virus movement patterns in the Eastern and Central flyways that are bridged by Illinois, a region shared between the 2 flyways. This specific pattern correlates with the looped migration patterns of terrestrial birds. Although other geographic regions may contribute to virus movement, there were insufficient virus sequences available from other states to incorporate into this analysis. Thus, on the basis of available information, 3 of the 8 locations considered (New York, Illinois, and Texas) seem to be the preferred sites for efficiently monitoring ongoing WNV evolution.
As new WNV sequences become available, similar phylogeographic methods can be used to develop more detailed information about WNV circulation in the United States. For example, on the East Coast, WNV circulation occurs southward, so surveillance efforts in the Northeast are likely to be more informative than surveillance in the Southeast. Conversely, WNV in the central United States travels northward, so surveillance in the south-central United States is more likely than surveillance in the north-central United States to be informative. Last, the region of overlap between the Eastern and Central flyways is the most likely location for deriving surveillance information because WNV in this area travels in multiple directions.
Collectively, the results of this study illustrate the value of using multidisciplinary approaches to surveillance of infectious diseases, especially zoonotic diseases. Animal migration is shaped by a delicate balance of ecologic factors and anthropomorphic barriers. Natural and manmade events (e.g., climate change, atmospheric fluctuations, habitat destruction) can drastically alter host behavior, which in turn affects the circulation patterns of infectious agents such as WNV. In this study, we defined the patterns of WNV circulation and key areas for surveillance and correlated them with the migratory patterns of their primary reservoir, terrestrial birds. Although this information does not enable prediction of the size of annual WNV outbreaks, these advancements support the construction of targeted surveillance and vector mitigation strategies to predict the annual flow of WNV strains and to enable public health officials to anticipate changes in WNV circulation resulting from altered bird migration.
Dr. Swetnam is a postdoctoral fellow at the University of California at Davis. Her research interests include the evolution and molecular epidemiology of zoonotic and emerging diseases.
Acknowledgment
This study was supported in part by National Institutes of Health contracts N01-AI 25489, N01-AI30027, and HHSN272201000040I/HHSN27200004/D04 to R.B.T. and grant AI 067847 to A.D.T.B.
References
- Añez G, Grinev A, Chancey C, Ball C, Akolkar N, Land KJ, et al. Evolutionary dynamics of West Nile virus in the United States, 1999–2011: phylogeny, selection pressure and evolutionary time-scale analysis [cited 2013 Dec 13]. http://dx.plos.org/10.1371/journal.pntd.0002245
- Formosinho P, Santos-Silva MM. Experimental infection of Hyalomma marginatum ticks with West Nile virus. Acta Virol. 2006;50:175–80.PubMed
- Komar N, Langevin S, Hinten S, Nemeth N, Edwards E, Hettler D, et al. Experimental infection of North American birds with the New York 1999 strain of West Nile virus. Emerg Infect Dis. 2003;9:311–22.file:///\\\\\\\\cdc.gov\\\\project\\\\CCID_NCPDCID_DEISS_EIDJ\\\\EID%20Production\\\\Editorial\\\\EDITING\\\\Lynne\\\\2018\\\\Dec18\\\\18-0382\\\\%20PubMed DOIPubMed
- La Sorte FA, Fink D, Hochachka WM, Farnsworth A, Rodewald AD, Rosenberg KV, et al. The role of atmospheric conditions in the seasonal dynamics of North American migration flyways. J Biogeogr. 2014;41:1685–96. DOI
- Klaassen RHG, Strandberg R, Hake M, Olofsson P, Tøttrup AP, Alerstam T. Loop migration in adult marsh harriers Circus aeruginosus, as revealed by satellite telemetry. J Avian Biol. 2010;41:200–7. DOI
- Mellone U, López-López P, Limiñana R, Piasevoli G, Urios V. The trans-equatorial loop migration system of Eleonora’s falcon: differences in migration patterns between age classes, regions and seasons. J Avian Biol. 2013;44 [cited 2018 Oct 5]. http://doi.wiley.com/10.1111/j.1600-048X.2013.00139.x
- Boere GC, Stroud DA. The flyway concept: what it is and what it isn’t. In: Boere GC, Galbraith C., Stroud DA, editors. Waterbirds around the World. Edinburgh: The Stationery Office; 2006. p. 40–4.
- Hatcher EL, Zhdanov SA, Bao Y, Blinkova O, Nawrocki EP, Ostapchuck Y, et al. Virus Variation Resource - improved response to emergent viral outbreaks. Nucleic Acids Res. 2017;45(D1):D482–90.file:///\\\\\\\\Cdc.gov\\\\project\\\\CCID_NCPDCID_DEISS_EIDJ\\\\EID%20Production\\\\Editorial\\\\Dec%2018%20Proofing\\\\%20PubMed DOIPubMed
- Health UTMB. World Reference Center for Emerging Viruses and Arboviruses [cited 2018 Feb 20]. https://www.utmb.edu/wrceva/home
- Langmead B, Salzberg SL. Fast gapped-read alignment with Bowtie 2 [cited 2014 Mar 19]. http://www.pubmedcentral.nih.gov/articlerender.fcgi?artid=3322381&tool=pmcentrez&rendertype=abstract
- Miller MA, Pfeiffer W, Schwartz T. Creating the CIPRES Science Gateway for inference of large phylogenetic trees [cited 2018 Oct 5].http://ieeexplore.ieee.org/document/5676129/
- Rambaut A, Lam TT, Max Carvalho L, Pybus OG. Exploring the temporal structure of heterochronous sequences using TempEst (formerly Path-O-Gen) [cited 2018 Oct 5].http://ve.oxfordjournals.org/lookup/doi/10.1093/ve/vew007
- US Census Bureau. State intercensal tables: 2000–2010 [cited 2018 Oct 3]. https://www.census.gov/data/tables/time-series/demo/popest/intercensal-2000-2010-state.html
Figures
Tables
Cite This ArticleOriginal Publication Date: 11/1/2018


.png)


.png)


No hay comentarios:
Publicar un comentario