
| MMWR Weekly (No. 11) PDF of this issue |
QuickStats: Age-Adjusted Percentage* of Adults Aged ≥18 Years Who Reported That They Needed Dental Care During the Past 12 Months But Didn’t Get It Because They Couldn’t Afford It,† by Sex, Race, and Hispanic Origin§ — National Health Interview Survey, 2017¶
Weekly / March 22, 2019 / 68(11);273
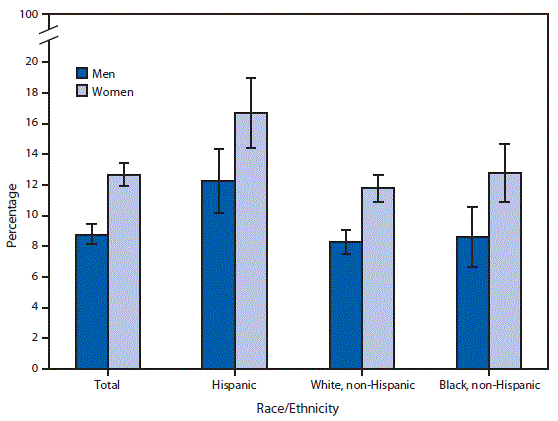
* With 95% confidence intervals indicated with error bars.
† Based on a question that asked respondents “During the past 12 months, was there any time when you needed any of the following but didn’t get it because you couldn’t afford it: Dental care (including check-ups)?” Persons who said they did not know or refused to answer were considered unknown and not included in the analysis.
§ Categories shown are for Hispanic adults, who might be of any race or combination of races, and non‐Hispanic adults who selected one racial group; not all racial groups are shown. Percentages shown for “Total” are based on all adults aged ≥18 years.
¶ Estimates are based on household interviews of a sample of the civilian, noninstitutionalized U.S. population aged ≥18 years and are age-adjusted using the projected 2000 U.S. population as the standard population and four age groups: 18–44, 45–64, 65–74, and ≥75 years.
In 2017, more women (12.7%) than men (8.8%) reported that at some time during the past 12 months they needed dental care but didn’t get it because they couldn’t afford it. This pattern was consistent within each racial/ethnic group: Hispanic, non-Hispanic white, and non-Hispanic black. Among both men and women, Hispanic adults were most likely to have unmet needs for dental care because they couldn’t afford it. Nearly 17% of Hispanic women could not afford to meet their dental care needs, compared with 12.8% of non-Hispanic black women and 11.8% of non-Hispanic white women; 12.3% of Hispanic men had unmet dental care needs, compared with 8.6% of non-Hispanic black men and 8.3% of non-Hispanic white men.
Source: Tables of Summary Health Statistics, 2017. https://ftp.cdc.gov/pub/Health_Statistics/NCHS/NHIS/SHS/2017_SHS_Table_A-19.pdf.
Reported by: Debra L. Blackwell, PhD, DBlackwell@cdc.gov, 301-458-4103; Maria A. Villarroel, PhD.


.png)


No hay comentarios:
Publicar un comentario