
| MMWR Weekly (No. 10) PDF of this issue |
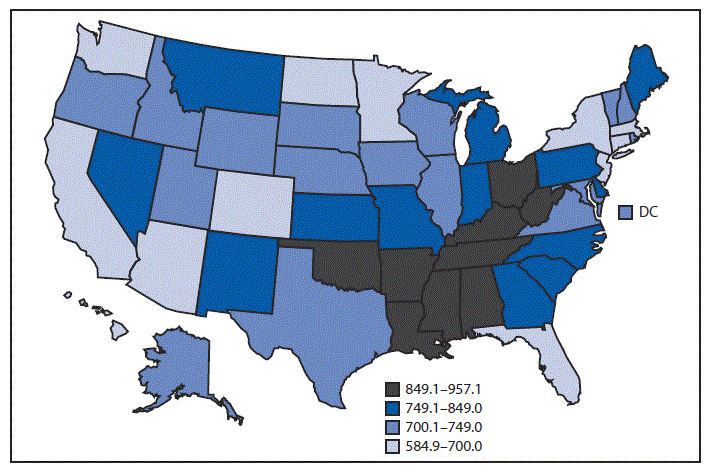
QuickStats: Age-Adjusted Death Rates,* by State — United States,† 2017
Weekly / March 15, 2019 / 68(10);255
Abbreviation: DC = District of Columbia.
* Deaths per 100,000, age-adjusted to the 2000 U.S. standard population.
† The U.S. rate was 731.9 deaths per 100,000 standard population in 2017.
In 2017, the overall U.S. death rate was 731.9 per 100,000 standard population; rates varied by state. The five states with the highest age-adjusted death rates were West Virginia (957.1 deaths per 100,000 standard population), Mississippi (951.3), Kentucky (929.9), Alabama (917.7), and Oklahoma (902.4). The five states with the lowest death rates were Hawaii (584.9), California (618.7), New York (623.6), Connecticut (651.2), and Minnesota (656.4).
Source: National Vital Statistics System. Underlying cause of death data, 1999–2017. https://wonder.cdc.gov/ucd-icd10.html.
Reported by: Jiaquan Xu, MD, jiaquanxu@cdc.gov, 301-458-4086.


.png)


No hay comentarios:
Publicar un comentario