NCHS Data Brief
Number 203, May 2015
Serious Psychological Distress Among Adults: United States, 2009–2013
PDF Version  (430 KB)
(430 KB)Judith Weissman, Ph.D.; Laura A. Pratt, Ph.D.; Eric A. Miller, Ph.D.; and Jennifer D. Parker, Ph.D.
Key findings
Data from the National Health Interview Survey, 2009–2013- In every age group, women were more likely to have serious psychological distress than men.
- Among all adults, as income increased, the percentage with serious psychological distress decreased.
- Adults aged 18–64 with serious psychological distress were more likely to be uninsured (30.4%) than adults without serious psychological distress (20.5%).
- More than one-quarter of adults aged 65 and over with serious psychological distress (27.3%) had limitations in activities of daily living.
- Adults with serious psychological distress were more likely to have chronic obstructive pulmonary disease, heart disease, and diabetes than adults without serious psychological distress.
Serious psychological distress includes mental health problems severe enough to cause moderate-to-serious impairment in social, occupational, or school functioning and to require treatment (1). Data from the 2009–2013 National Health Interview Survey (NHIS) are used to estimate the prevalence of serious psychological distress—measured by a score of 13 or greater on the Kessler 6 (K6) nonspecific distress scale—among adults overall and by demographic characteristics. The K6 obtains information on the frequency of six psychological distress symptoms (2). This report also compares health insurance and health characteristics between those with and those without serious psychological distress.
Keywords: mental health, health insurance coverage, poverty, National Health Interview Survey
In every age group, women were more likely to have serious psychological distress than men.
Among adults aged 18 and over, 3.4% had serious psychological distress, including 3.9% of women and 2.8% of men (Figure 1).
Adults aged 45–64 were more likely to have serious psychological distress (4.3%) than adults aged 18–44 (3.1%) or adults aged 65 and over (2.4%).
Figure 1. Percentage of adults aged 18 and over at interview with serious psychological distress, by sex and age: United States, 2009–2013
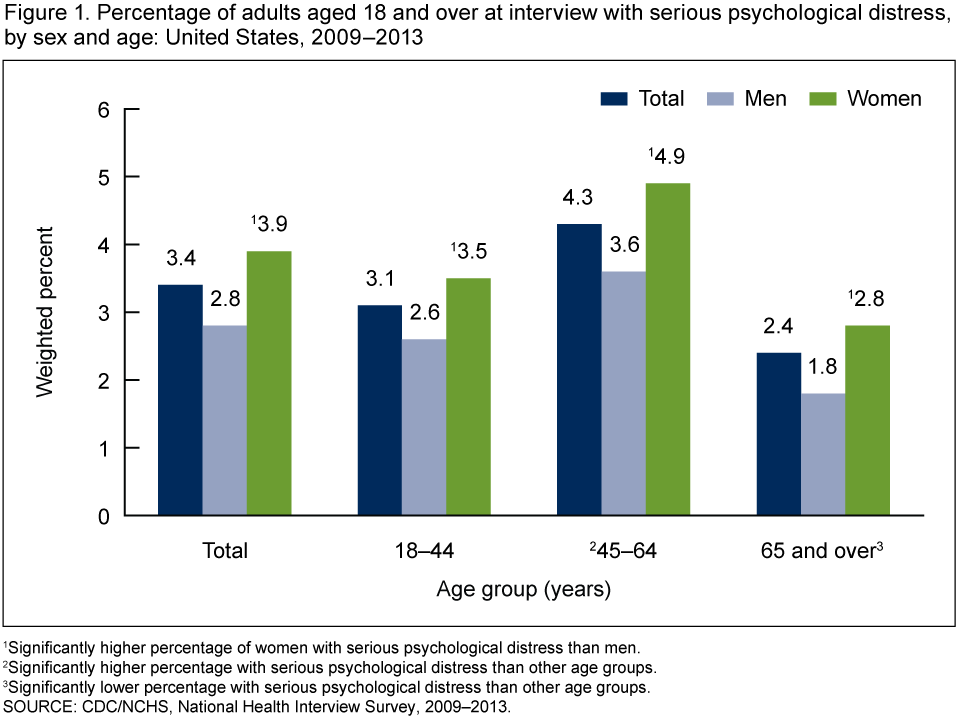
1Significantly higher percentage of women with serious psychological distress than men.
2Significantly higher percentage with serious psychological distress than other age groups.
3Significantly lower percentage with serious psychological distress than other age groups.
SOURCE: CDC/NCHS, National Health Interview Survey, 2009–2013.
2Significantly higher percentage with serious psychological distress than other age groups.
3Significantly lower percentage with serious psychological distress than other age groups.
SOURCE: CDC/NCHS, National Health Interview Survey, 2009–2013.
As income increased, the age-adjusted percentage with serious psychological distress decreased.
A total of 8.7% of adults with income below the federal poverty level had serious psychological distress, compared with 1.2% of adults with incomes at or above 400% of the poverty level (Figure 2).
Serious psychological distress affects 3.3% of non-Hispanic white, 3.7% of non-Hispanic black, and 3.8% of Hispanic adults.
The age-adjusted percentage of non-Hispanic white adults with serious psychological distress was lower compared with non-Hispanic black and Hispanic adults.
Figure 2. Age-adjusted percentage of adults with serious psychological distress, by income relative to federal poverty level and by race and ethnicity: United States, 2009–2013
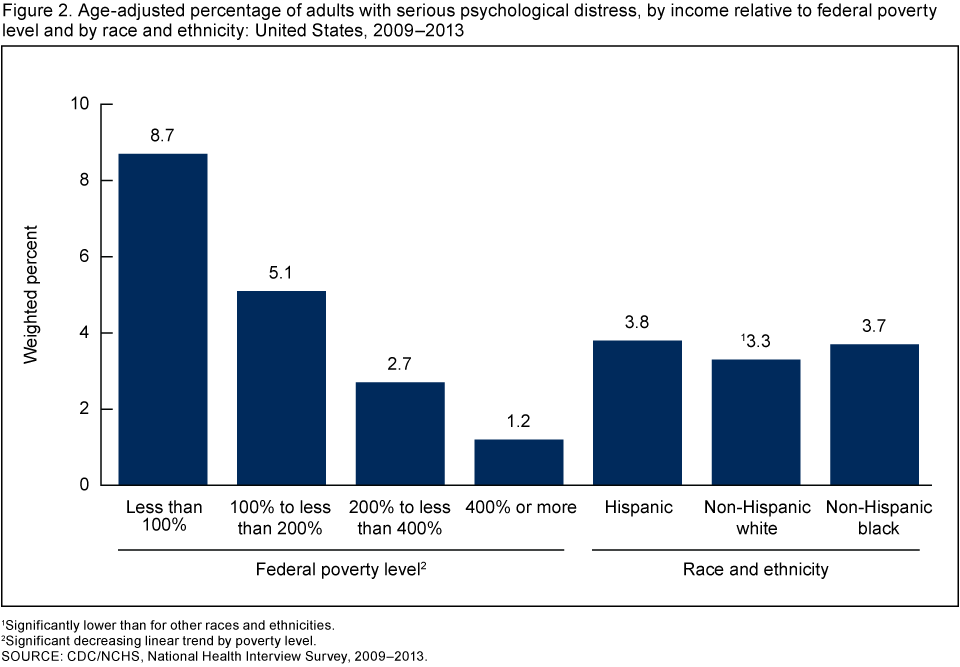
1Significantly lower than for other races and ethnicities.
2Significant decreasing linear trend by poverty level.
SOURCE: CDC/NCHS, National Health Interview Survey, 2009–2013.
2Significant decreasing linear trend by poverty level.
SOURCE: CDC/NCHS, National Health Interview Survey, 2009–2013.
Adults aged 18–64 with serious psychological distress were more likely to be uninsured than adults without serious psychological distress.
Among adults aged 18–64, 30.4% with serious psychological distress were uninsured compared with 20.5% without serious psychological distress (Figure 3).
In age group 18–44, 37.4% of adults with serious psychological distress were uninsured, compared with 23.5% of adults aged 45–64.
In both age groups, the percentage uninsured was higher among adults with serious psychological distress than among those without the condition.
Figure 3. Percentage of adults aged 18–64 who were uninsured at interview, by serious psychological distress status and age: United States, 2009–2013
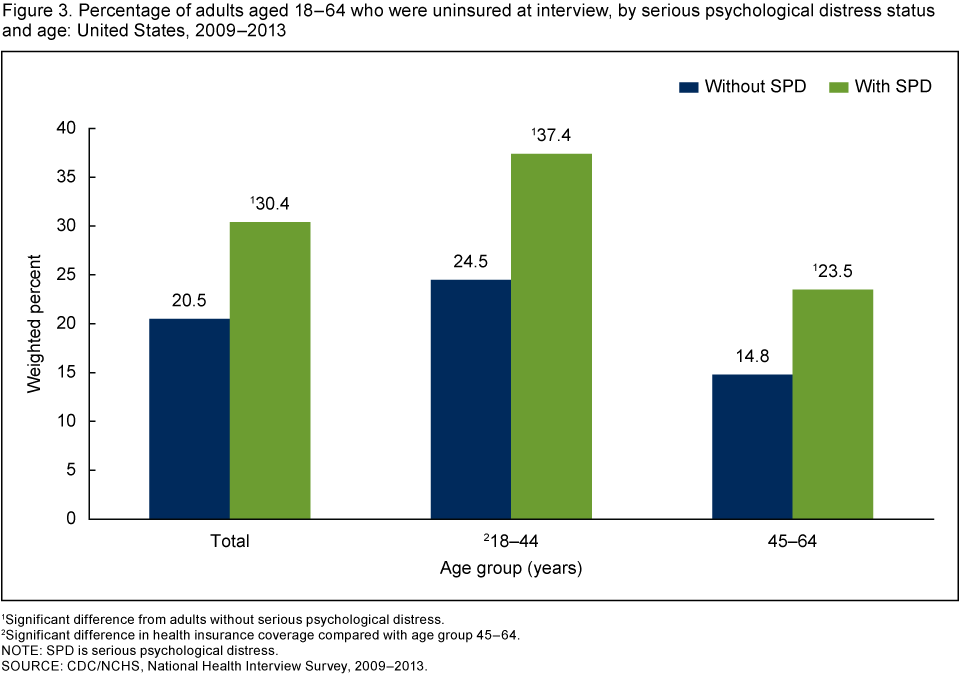
1Significant difference from adults without serious psychological distress.
2Significant difference in health insurance coverage compared with age group 45–64.
NOTE: SPD is serious psychological distress.
SOURCE: CDC/NCHS, National Health Interview Survey, 2009–2013.
2Significant difference in health insurance coverage compared with age group 45–64.
NOTE: SPD is serious psychological distress.
SOURCE: CDC/NCHS, National Health Interview Survey, 2009–2013.
More than one-quarter of adults aged 65 and over with serious psychological distress had limitations in activities of daily living.
Within the adult noninstitutionalized population, with or without serious psychological distress, the percentage with limitations in activities of daily living (ADL) increased with age (Figure 4).
Among adults aged 18–44, those with serious psychological distress were more than 10 times as likely to have ADL limitations as those without serious psychological distress.
Among those aged 45–64, adults with serious psychological distress were about eight times as likely to have ADL limitations as those without serious psychological distress.
Adults aged 65 and over with serious psychological distress were almost five times as likely to have ADL limitations as those without serious psychological distress in that age group.
Figure 4. Percentage of adults aged 18 and over with limitations in activities of daily living at interview, by serious psychological distress status and age: United States, 2009–2013
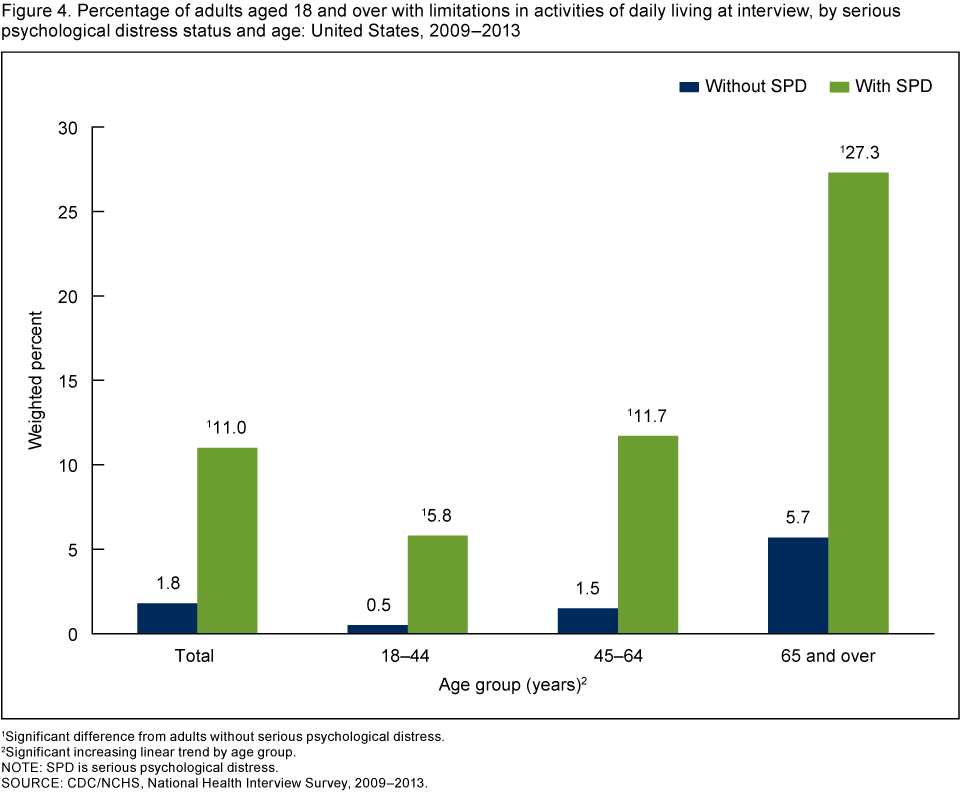
1Significant difference from adults without serious psychological distress.
2Significant increasing linear trend by age group.
NOTE: SPD is serious psychological distress.
SOURCE: CDC/NCHS, National Health Interview Survey, 2009–2013.
2Significant increasing linear trend by age group.
NOTE: SPD is serious psychological distress.
SOURCE: CDC/NCHS, National Health Interview Survey, 2009–2013.
Adults with serious psychological distress were more likely to have chronic obstructive pulmonary disease, heart disease, and diabetes compared with adults without serious psychological distress.
After age adjustment, men and women with serious psychological distress were approximately four times as likely to have chronic obstructive pulmonary disease (COPD) as men and women without serious psychological distress (Figure 5).
Men and women with serious psychological distress were approximately twice as likely after age adjustment to have either heart disease or diabetes as men and women without serious psychological distress.
Figure 5. Age-adjusted percentage of adults aged 18 and over with COPD, heart disease, or diabetes at interview, by serious psychological distress status and sex: United States, 2009–2013
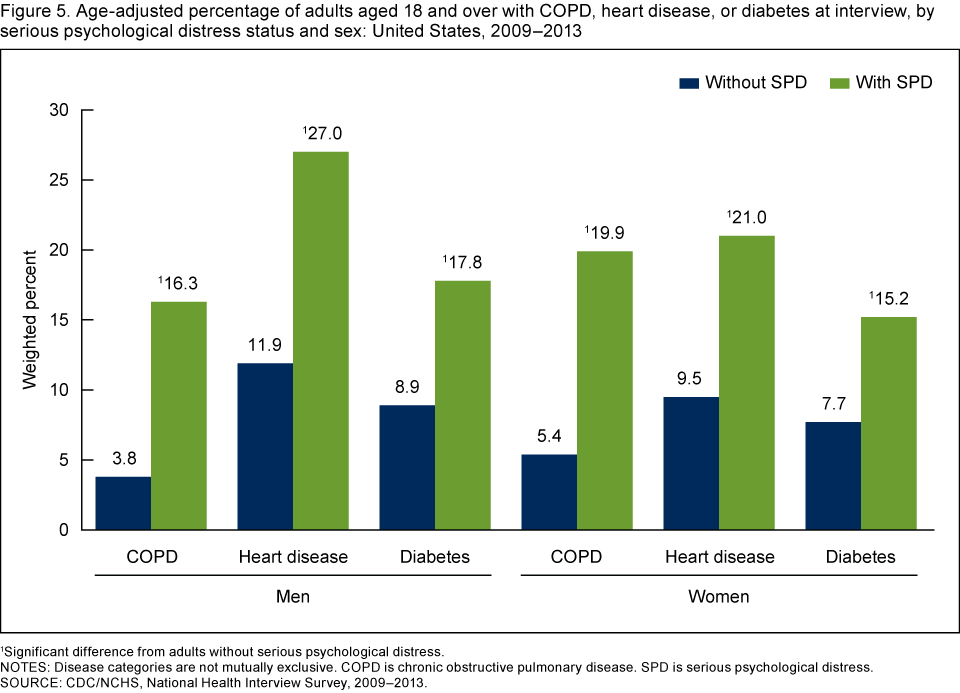
1Significant difference from adults without serious psychological distress.
NOTES: Disease categories are not mutually exclusive. COPD is chronic obstructive pulmonary disease. SPD is serious psychological distress.
SOURCE: CDC/NCHS, National Health Interview Survey, 2009–2013.
NOTES: Disease categories are not mutually exclusive. COPD is chronic obstructive pulmonary disease. SPD is serious psychological distress.
SOURCE: CDC/NCHS, National Health Interview Survey, 2009–2013.
Summary
During 2009–2013, 3.3% of the civilian noninstitutionalized population aged 18 and over had serious psychological distress. The condition was most prevalent in the 45–64 age group and least prevalent in ages 65 and over. The age-adjusted percentage of adults with serious psychological distress decreased as income increased relative to the federal poverty level. Adults with serious psychological distress were more likely not to have health insurance than those without serious psychological distress, and adults aged 18–44 with serious psychological distress were more often uninsured compared with those aged 45–64. More than one-quarter of adults aged 65 and over with serious psychological distress had ADL limitations; by comparison, approximately 6% of those in the same age group without serious psychological distress had such limitations. Those aged 18 and over with serious psychological distress were more likely to have ADL limitations, and to have COPD, heart disease, or diabetes, than adults without serious psychological distress.
Definitions
Age-adjusted estimates: Prevalence estimates for race, Hispanic origin, and chronic condition categories were age-adjusted to the 2000 U.S. census population using the direct method for age groups 18–44, 45–64, and 65 and over (3).
Chronic obstructive pulmonary disease (COPD): Defined by the American Thoracic Society as a preventable and treatable disease state characterized by airflow limitation that is not fully reversible. COPD is based on separate self-reported responses to survey questions about whether the respondents had been told by a doctor or other health professional that they had chronic bronchitis in the past 12 months or ever had emphysema (4).
Diabetes: Based on self-reported responses to survey questions about whether the respondents had ever been told by a doctor or other health professional that they had diabetes or sugar diabetes. Respondents who reported having borderline diabetes were not considered to have diabetes.
Heart disease: Based on self-reported responses to survey questions about whether the respondents had ever been told by a doctor or other health professional that they had coronary heart disease, angina (angina pectoris), a heart attack (myocardial infarction), or any other kind of heart disease or heart condition.
Insurance coverage: Adults covered by private, public, or military insurance were considered to have health insurance. Persons without private, public, or military insurance, and those with only Indian Health Service coverage or only a private plan that paid for one type of service such as accidents or dental care, were considered uninsured. The years included in this analysis, 2009–2013, overlap with the Affordable Care Act’s dependent coverage provision in 2010, which increased insurance coverage within age group 19–25 (5).
Limitations in activities of daily living (ADL): Defined by answering “yes” to the survey question, “Because of a physical, mental, or emotional problem, (do you/does anyone in the family) need the help of other persons with PERSONAL CARE NEEDS, such as eating, bathing, dressing, or getting around inside this home?”
Serious psychological distress: Defined as having a score greater than or equal to 13 on the Kessler 6 (K6) nonspecific distress scale (2). The six-question K6 was developed to identify persons with a high likelihood of having a diagnosable mental illness and associated functional limitations, using as few questions as possible. The K6 asks about the frequency of each of the six symptoms of mental illness or nonspecific psychological distress:
“During the PAST 30 DAYS, how often did you feel …
1. So sad that nothing could cheer you up; 2. Nervous; 3. Restless or fidgety; 4. Hopeless; 5. That everything was an effort; and 6. Worthless.”
“During the PAST 30 DAYS, how often did you feel …
1. So sad that nothing could cheer you up; 2. Nervous; 3. Restless or fidgety; 4. Hopeless; 5. That everything was an effort; and 6. Worthless.”
Only participants who answered all six questions were included in the analysis. In a range of possible scores from 0–24, a calibration study found that a score of 13 was the best cut-off to balance false-positive and false-negative classification of psychological distress (2). In 2013, the K6 questions were moved to a new Adult Selected Items section in NHIS, which may have changed how respondents answered the questions compared with earlier years.
Federal poverty level: Based on reported and imputed family income, family size, and number of children in the family, and for families with two or fewer adults, based on the age of adults in the family. For more details, see the U.S. Census Bureau website at:http://www.census.gov/hhes/www/poverty/poverty.html (6). Note that NHIS asks respondents about their personal earnings and family income for the previous calendar year.
(6). Note that NHIS asks respondents about their personal earnings and family income for the previous calendar year.Data source and methods
Data from the 2009–2013 NHIS were used for this analysis. NHIS data were collected continuously throughout the year for the Centers for Disease Control and Prevention’s (CDC) National Center for Health Statistics (NCHS) by interviewers from the U.S. Census Bureau. NHIS collects information about the health and health care of the civilian noninstitutionalized U.S. population. Interviews are conducted in respondents’ homes, but follow-ups in order to complete interviews may be conducted over the telephone.
Point estimates were calculated using sample weights, and corresponding variances accounted for the complex sample design of NHIS. The Taylor series linearization method was chosen for variance estimation. All estimates shown in this report have a relative standard error less than or equal to 30%.
Overall associations for categorical variables were evaluated using chi square statistics. Differences between subgroups within a categorical variable were evaluated using univariate t statistics. Differences between percentages were evaluated using two-sided significance tests at the 0.05 level. Logistic regression and ANOVA Cochran Mantel Haenszel tests were performed to evaluate trends for age and poverty groups.
For 2009–2013, approximately 16% of NHIS respondents were missing data on family income and personal earnings. To analyze poverty status, NHIS’ imputed personal earning and income files were used (7). Appropriate statistical methods were applied to combine the estimates for these imputations. All analyses were conducted using SAS-callable SUDAAN software (8).
About the authors
Judith Weissman, Laura A. Pratt, Eric A. Miller, and Jennifer D. Parker are with CDC’s National Center for Health Statistics, Office of Analysis and Epidemiology.
References
Suggested citation
Weissman J, Pratt LA, Miller EA, Parker JD. Serious psychological distress among adults: United States, 2009–2013. NCHS data brief, no 203. Hyattsville, MD: National Center for Health Statistics. 2015.
Copyright information
All material appearing in this report is in the public domain and may be reproduced or copied without permission; citation as to source, however, is appreciated.
National Center for Health Statistics
Charles J. Rothwell, M.S., M.B.A., Director
Nathaniel Schenker, Ph.D., Deputy Director
Jennifer H. Madans, Ph.D., Associate Director for Science
Nathaniel Schenker, Ph.D., Deputy Director
Jennifer H. Madans, Ph.D., Associate Director for Science
Office of Analysis and Epidemiology
Irma E. Arispe, Ph.D., Director


.png)


No hay comentarios:
Publicar un comentario