NCHS Data Brief
Number 162, August 2014
Recent Declines in Nonmarital Childbearing in the United States
PDF Version  (624 KB)
(624 KB)Sally C. Curtin, M.A.; Stephanie J. Ventura, M.A.; and Gladys M. Martinez, Ph.D.
Key findings
Data from the National Vital Statistics System and the National Survey of Family Growth
- Nonmarital births and birth rates have declined 7% and 14%, respectively, since peaking in the late 2000s.
- Births to unmarried women totaled 1,605,643 in 2013. About 4 in 10 U.S. births were to unmarried women in each year from 2007 through 2013.
- Nonmarital birth rates fell in all age groups under 35 since 2007; rates increased for women aged 35 and over.
- Birth rates were down more for unmarried black and Hispanic women than for unmarried non-Hispanic white women.
- Nonmarital births are increasingly likely to occur within cohabiting unions—rising from 41% of recent births in 2002 to 58% in 2006–2010.
There were sharp increases in nonmarital childbearing from 2002 to 2007, following the steady increases beginning in the 1980s (1–3). The upward trends have mainly reversed since 2007–2008. In addition, the nature of nonmarital childbearing may be changing as cohabiting unions have increased over the last few decades in the United States along with pregnancies within those unions (4). Births to unmarried women are at greater risk for adverse outcomes, including low birth weight, preterm birth, and infant mortality (5,6). Social and financial supports for unmarried mothers may be limited (7). This report describes recent trends in nonmarital births from the National Vital Statistics System (NVSS) and in cohabitation for unmarried mothers using data from the National Survey of Family Growth (NSFG).
Keywords: National Vital Statistics System, National Survey of Family Growth, nonmarital births, cohabitation
The number and rate of nonmarital childbearing declined from the 2008 peak.
Figure 1. Number of births, birth rate, and percentage of births to unmarried women: United States, 1940–2013

NOTE: Data for 2013 are preliminary. Access data table for Figure 1 [PDF - 84KB].
SOURCE: CDC/NCHS, National Vital Statistics System.
[PDF - 84KB].SOURCE: CDC/NCHS, National Vital Statistics System.
- In 2013, there were 1,605,643 births to unmarried women [preliminary data for 2013 (8)], the lowest total since 2005 (1,527,034), and 7% lower than the all-time peak in 2008 (1,726,566) (Figure 1). The 2013 number is more than twice that in 1980 (665,747) and 18 times higher than in 1940 (89,500).
- The nonmarital birth rate has declined steadily since its peak in 2007–2008 (51.8 per 1,000 women aged 15–44), to 44.8 in 2013, a 14% decline. While the trend in the nonmarital birth rate had been mostly upward from 1940 to 1994 when it stabilized for almost a decade, there were periods of decline during the 1970s. The current decline is the steepest.
- The percentage of births to unmarried women declined slightly in 2013 to 40.6%, after holding steady from 2011 to 2012 at 40.7%; the percentage peaked in 2009 at 41.0%.
The recent declines were evident for all age groups of women under age 35.
- Nonmarital birth rates were highest in 2012 for women aged 25–29 (67 per 1,000), followed by women aged 20–24 (65 per 1,000) (Figure 2). After increasing between 2002 and 2007, rates declined for both of these age groups from 2007 to 2012, by 19% for women aged 20–24 and by 13% for women aged 25–29.

SOURCE: CDC/NCHS, National Vital Statistics System.
- The largest percentage drop in nonmarital birth rates between 2007 and 2012 was for teenagers—the rate for those aged 15–17 dropped 30% to 14 per 1,000, while the rate for those aged 18–19 dropped 26% to 46 per 1,000.
- Nonmarital birth rates for women aged 35–39 and 40–44 increased over the decade 2002–2012. The rate for women aged 35–39 was 7% higher in 2012 than in 2007 (31 per 1,000 compared with 29 per 1,000) and 48% higher than in 2002 (21 per 1,000). The nonmarital birth rate for women aged 40–44 increased to 9 per 1,000 in 2012, 29% higher than in 2007 (7 per 1,000).
The sharpest declines in nonmarital birth rates were for black and Hispanic women.
- After increasing between 2002 and 2007, birth rates for unmarried women were lower in 2012 than in 2007 for all race and Hispanic groups (Figure 3). Hispanic women had the highest nonmarital birth rate in 2012 (73 per 1,000) but also the greatest decline since 2007 (28%, from 102 per 1,000). The rate for black women declined 11% between 2007 (71 per 1,000) and 2012 (63 per 1,000).
Figure 3. Birth rates for unmarried women, by race and Hispanic origin: United States, 2002, 2007, and 2012

† Trend data for black and Asian or Pacific Islander mothers by Hispanic origin are not available.
SOURCE: CDC/NCHS, National Vital Statistics System.
SOURCE: CDC/NCHS, National Vital Statistics System.
- After increasing 21% between 2002 and 2007, the nonmarital birth rate for non-Hispanic white women dropped 6% to 32 per 1,000 in 2012. The nonmarital birth rate for non-Hispanic white women in 2012 was about one-half that of black and Hispanic women.
- The nonmarital birth rate for Asian or Pacific Islander (API) women was the lowest of all race and Hispanic groups and had the smallest decline between 2007 (24 per 1,000) and 2012 (23 per 1,000).
Nonmarital births were increasingly likely to occur within cohabiting unions.
- Nonmarital births include births to women in cohabiting unions and those to unmarried women not cohabiting. Between 2002 and 2006–2010, the percentage of recent nonmarital births that occurred within cohabiting unions increased from 41% to 58% (Figure 4). Approximately one-half of births to cohabiting women in both 2002 and 2006–2010 were intended at conception (9).
Figure 4. Nonmarital births, by cohabiting status and intendedness of pregnancy: United States, 2002 and 2006–2010
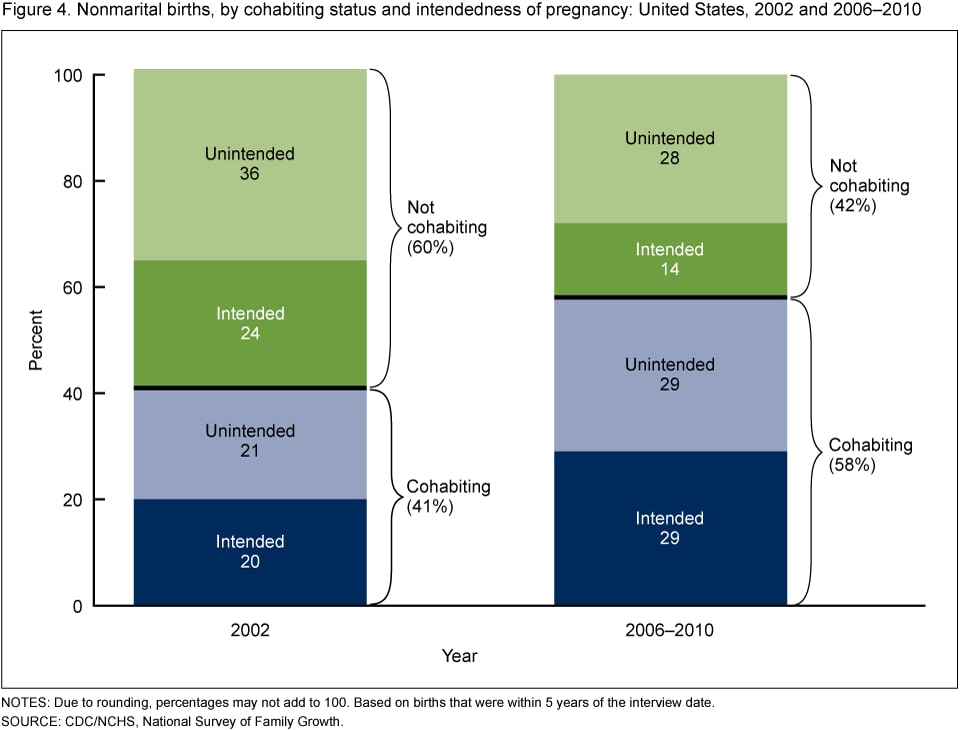
NOTES: Due to rounding, percentages may not add to 100. Based on births that were within 5 years of the interview date.
SOURCE: CDC/NCHS, National Survey of Family Growth.
SOURCE: CDC/NCHS, National Survey of Family Growth.
- While 20% of nonmarital births in 2002 were within a cohabiting union and intended, almost twice as many (36%) occurred to noncohabiting women and were unintended. However, in 2006–2010, the percentage of nonmarital births to women in cohabiting unions that were intended was essentially the same as for those that were noncohabiting and unintended (29% and 28%).
- The proportion of nonmarital births that were intended (including births to both women in cohabiting unions and those not in cohabiting unions) was similar between 2002 and 2006–2010 (44% and 43%).
- Nonmarital births in 2006–2010 to women not in cohabiting unions were least likely to be intended births (14%).
Summary
This report highlights recent declines in nonmarital childbearing since 2007 as well as shifts in childbearing within cohabiting unions since 2002. The recent declines in birth rates and numbers of births to unmarried women parallel to some extent the overall decline in birth rates during this period and also reflect the declines in teen birth rates (8,10); the majority of births to teenagers are to unmarried women (8). The recent declines in nonmarital birth rates have been evident across age groups of women under age 35 and for all race and Hispanic groups. Birth rates have fallen more for black and Hispanic women, thus narrowing the differences across groups. Trends in birth rates among married women have not followed the same pattern as those among unmarried women. Birth rates among married women declined from 2007 to 2010, although to a lesser extent compared with unmarried women, but have since increased slightly.
The percentage of births to unmarried women is a third measure of nonmarital childbearing. Of the three measures, the percentage of births to unmarried women has shown the least recent change, declining slightly since its 2009 peak (10). This measure reflects changes in the birth rate for unmarried women but is also influenced by the changes in birth rates for married women.
Nearly three in five recent births to unmarried women in 2006–2010 were to women in cohabiting relationships, significantly higher than the 41% found in 2002. While cohabiting unions tend to be less stable than marriages (4) nonetheless, one-half of births to cohabiting women were intended in 2006–2010 (9,11). This may suggest a higher level of social and financial support within a cohabiting union for the mother and her child (7). A recent NSFG report showed that several measures of father involvement were very similar among married and cohabiting fathers (12). The extent to which cohabitation is a marker for social and financial support and for father involvement deserves further exploration.
Definitions
Unmarried woman: A woman who has never married or is widowed or divorced. Marital status on the birth certificate is based on the mother’s legal marital status. Women who are separated are included with married women.
Nonmarital birth: A birth to an unmarried woman. The mother’s marital status is based on a question on the birth certificate. In most states, the question is: “Mother married? (At birth, conception, or any time between) (Yes or No).” If the question is answered “no,” then the birth is considered nonmarital. Additional information on the classification of births by marital status is available elsewhere (2,5).
Cohabitation: Persons who are unmarried but “having a sexual relationship while sharing the same usual address.”
Birth rate for unmarried women: The number of births (regardless of age) to unmarried women per 1,000 unmarried women aged 15–44. Birth rates are also computed for specific age, race, and Hispanic groups.
Intended birth: A birth is defined as intended if a woman intended to get pregnant just before the pregnancy occurred (9,11).
Data sources and methods
This report contains data from the NVSS Natality Data File. The vital statistics natality file includes information for all births occurring in the United States. Mother’s marital status is collected by all states. This report includes final data through 2012 and preliminary data for 2013. Data for 2012 and earlier years may also be accessed from the interactive data access tool,VitalStats.
Data on cohabitation and pregnancy intentions are from the 2002 and 2006–2010 NSFG, conducted by the Centers for Disease Control and Prevention’s (CDC) National Center for Health Statistics. The data are based on pregnancies that ended within 5 years of the interview date.
Details on the collection of formal and informal marital status (including cohabitation) are available .
.
.Estimates of the female population by marital status used to produce birth rates for unmarried women are based on distributions of the population by marital status averaged over a 3-year period for each year. Details of the estimation procedures are presented elsewhere (2,5). Rates shown here for black and for API women are for all black and API women, respectively, including Hispanic and non-Hispanic women; 93% of nonmarital births to black women in 2012 were non-Hispanic; 88% of nonmarital births to API women in 2012 were non-Hispanic. Population data by marital status for non-Hispanic black and non-Hispanic API women separately have become available only in recent years.
About the authors
Sally C. Curtin, Stephanie J. Ventura, and Gladys M. Martinez are with CDC’s National Center for Health Statistics, Division of Vital Statistics.
References
Suggested citation
Curtin SC, Ventura SJ, Martinez GM. Recent declines in nonmarital childbearing in the United States. NCHS data brief, no 162. Hyattsville, MD: National Center for Health Statistics. 2014.
Copyright information
All material appearing in this report is in the public domain and may be reproduced or copied without permission; citation as to source, however, is appreciated.
National Center for Health Statistics
Charles J. Rothwell, M.S., M.B.A., Director
Jennifer H. Madans, Ph.D., Associate Director for Science
Jennifer H. Madans, Ph.D., Associate Director for Science
Division of Vital Statistics
Delton Atkinson, M.P.H., M.P.H., P.M.P., Director


.png)


.png)


No hay comentarios:
Publicar un comentario