Aporte a la rutina de la trinchera asistencial donde los conocimientos se funden con las demandas de los pacientes, sus necesidades y las esperanzas de permanecer en la gracia de la SALUD.
jueves, 23 de agosto de 2018
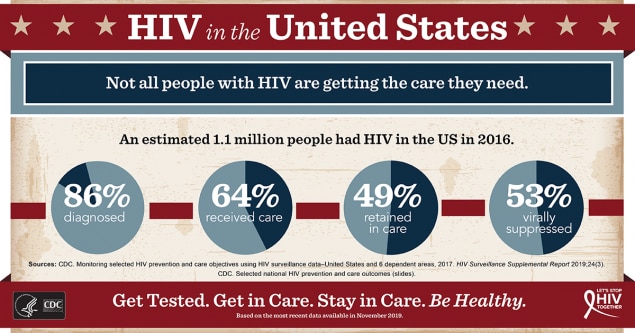
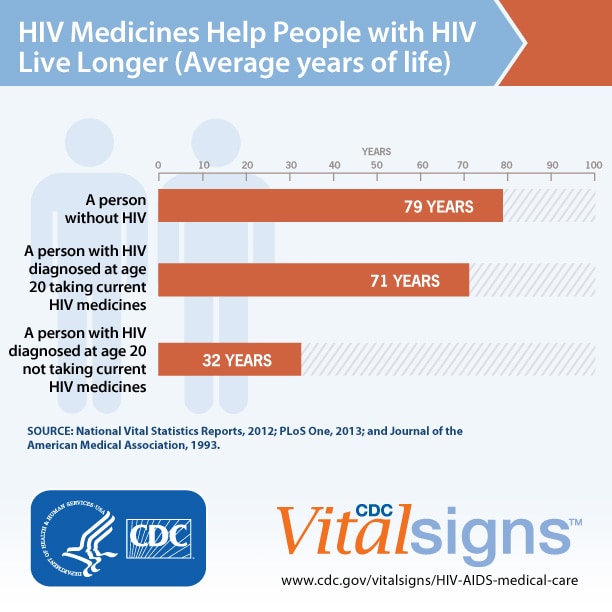
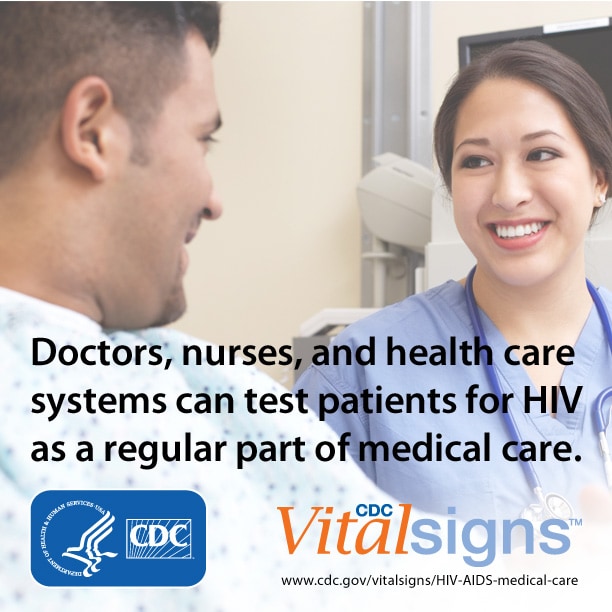
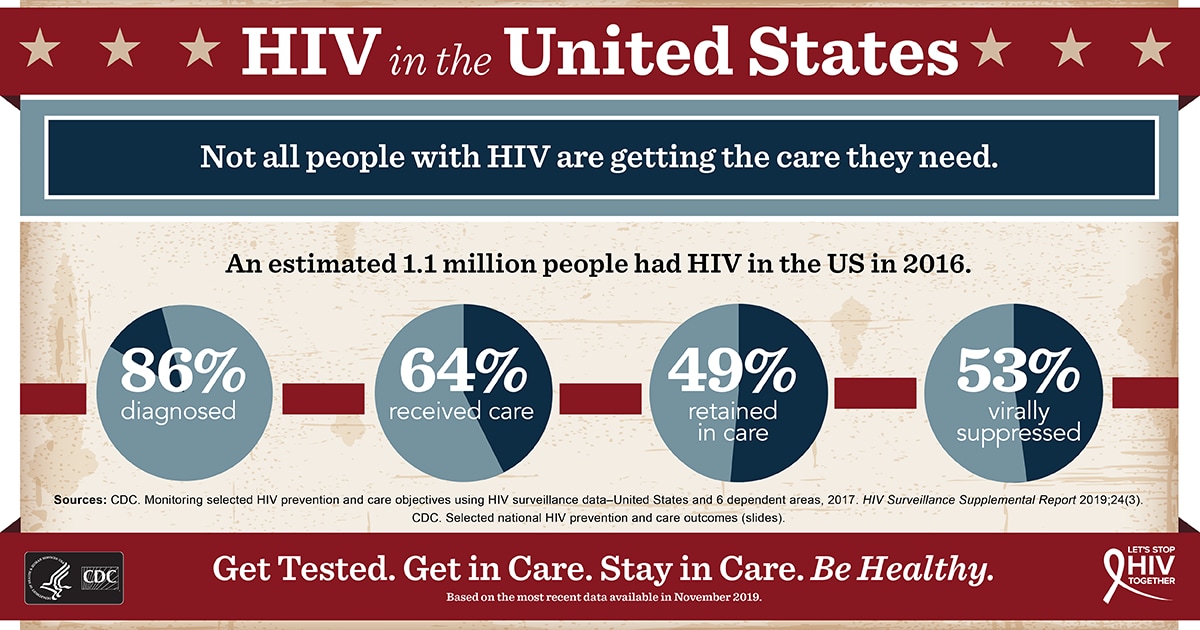
Infographics and Posters | Resource Library | HIV/AIDS | CDC
ver historia personal en: www.cerasale.com.ar [dado de baja por la Cancillería Argentina por temas políticos, propio de la censura que rige en nuestro medio]//
www.revistamedicos.com.ar //
www.quorumtuc.com.ar //
www.sectorsalud.com.ar //
www.maimonides.edu //
weblog.maimonides.edu/farmacia/archives/UM_Informe_Autoevaluacion_FyB.pdf - //
weblog.maimonides.edu/farmacia/archives/0216_Admin_FarmEcon.pdf - //
www.documentalistas.org.ar //
www.cpcesfe2.org.ar //
www.nogracias.eu //
www.estenssorome.com.ar //
www.cuautitlan.unam.mx/descargas/licenciaturas/bqd/plandestudio_bqd_ //
www.latamjpharm.org/trabajos/25/2/LAJOP_25_2_6_1_M4M6Z9746D.pdf //
www.nogracias.eu/v_juventud/informacion/informacionver.asp?cod= //
www.colfarse.com.ar //
www.proz.com/kudoz/english_to_spanish/art_literary/523942-key_factors.html - 65k - // www.llave.connmed.com.ar/portalnoticias_vernoticia.php?codigonoticia=17715 // www.frusculleda.com.ar/homepage/espanol/activities_teaching.htm // http://www.on24.com.ar/nota.aspx?idNot=36331 ||


.png)


No hay comentarios:
Publicar un comentario