Products - Data Briefs - Number 81 - December 2011
NCHS Data Brief
Number 81, December 2011
Drug Poisoning Deaths in the United States, 1980–2008
On This Page
- Key findings
- Poisoning is now the leading cause of death from injuries in the United States and nearly 9 out of 10 poisoning deaths are caused by drugs.
- Poisoning is the leading cause of death from injury in 30 states.
- Opioid analgesics were involved in more than 40% of drug poisoning deaths in 2008.
- Natural and semi-synthetic opioid analgesics such as morphine, hydrocodone, and oxycodone were involved in over 9,100 drug poisoning deaths in 2008, up from about 2,700 in 1999.
- In 2008, the drug poisoning death rate was higher among those aged 45–54 years than among those in other age groups.
- Summary
- Definitions
- Data sources and methods
- About the authors
- References
- Suggested citation
 (658 KB)
Margaret Warner, Ph.D.; Li Hui Chen, Ph.D.; Diane M. Makuc, Dr.P.H., Robert N. Anderson, Ph.D.; and Arialdi M. Miniño, M.P.H.
Key findings
Data from the National Vital Statistics System Mortality File- In 2008, poisoning became the leading cause of injury death in the United States and nearly 9 out of 10 poisoning deaths are caused by drugs.
- During the past three decades, the number of drug poisoning deaths increased sixfold from about 6,100 in 1980 to 36,500 in 2008.
- During the most recent decade, the number of drug poisoning deaths involving opioid analgesics more than tripled from about 4,000 in 1999 to 14,800 in 2008.
- Opioid analgesics were involved in more than 40% of all drug poisoning deaths in 2008, up from about 25% in 1999.
- In 2008, the drug poisoning death rate was higher for males, people aged 45–54 years, and non-Hispanic white and American Indian or Alaska Native persons than for females and those in other age and racial and ethnic groups.
Keywords: opioid analgesics • overdose • prescription pain relievers • National Vital Statistics System Mortality File
Poisoning is now the leading cause of death from injuries in the United States and nearly 9 out of 10 poisoning deaths are caused by drugs.
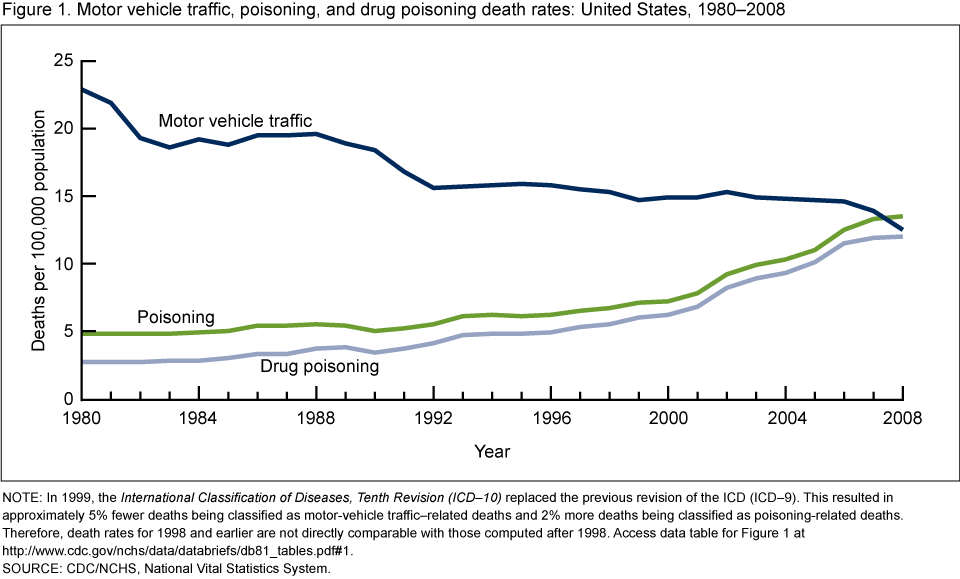
NOTE: In 1999, the International Classification of Diseases, Tenth Revision (ICD–10) replaced the previous revision of the ICD (ICD–9). This resulted in approximately 5% fewer deaths being classified as motor-vehicle traffic–related deaths and 2% more deaths being classified as poisoning-related deaths. Therefore, death rates for 1998 and earlier are not directly comparable with those computed after 1998. Access data table for Figure 1
. SOURCE: CDC/NCHS, National Vital Statistics System.
In 2008, the number of poisoning deaths exceeded the number of motor vehicle traffic deaths for the first time since at least 1980. In 2008, there were more than 41,000 poisoning deaths, compared with about 38,000 motor vehicle traffic deaths. In 2008, 89% of poisoning deaths were caused by drugs.
During the past three decades, the poisoning death rate per 100,000 population nearly tripled from 4.8 in 1980 to 13.5 in 2008, while the motor vehicle traffic death rate decreased by almost one-half from 22.9 in 1980 to 12.5 in 2008 (Figure 1). In the most recent decade, from 1999 to 2008, the poisoning death rate increased 90%, while the motor vehicle traffic death rate decreased 15%.
From 1980 to 2008, the percentage of poisoning deaths caused by drugs increased from 56% to 89%. In 2008, about 77% of the drug poisoning deaths were unintentional, 13% were suicides, and 9% were of undetermined intent (see Appendix table).
Poisoning is the leading cause of death from injury in 30 states.
In 2008, poisoning was the leading cause of injury death in the following 30 states: Alaska, Arizona, California, Colorado, Connecticut, Delaware, Florida, Hawaii, Illinois, Indiana, Kentucky, Maine, Maryland, Massachusetts, Michigan, Minnesota, Nevada, New Hampshire, New Jersey, New Mexico, New York, Ohio, Oregon, Pennsylvania, Rhode Island, Utah, Vermont, Washington, West Virginia, and Wisconsin (Figure 2).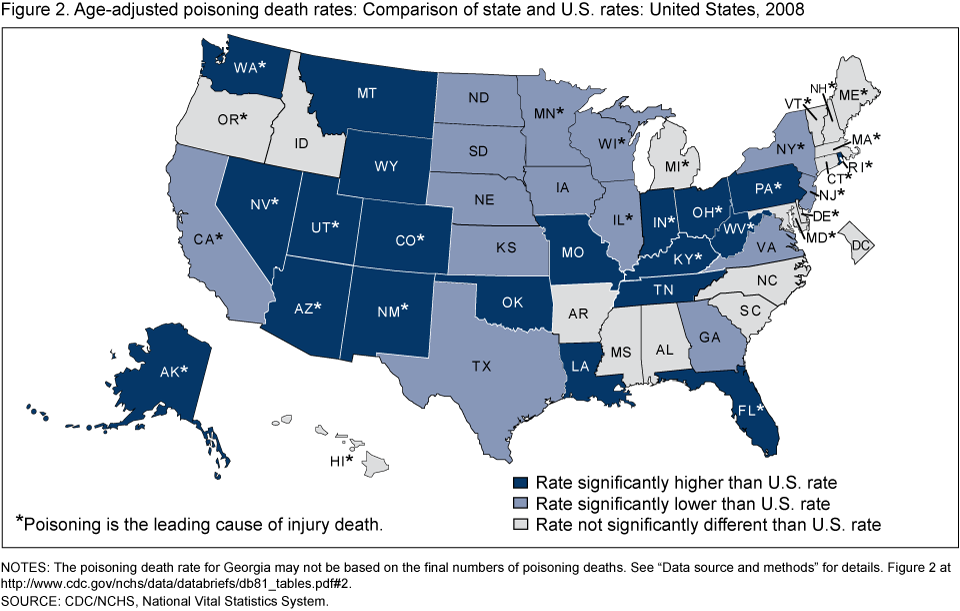
NOTES: The poisoning death rate for Georgia may not be based on the final numbers of poisoning deaths. See "Data source and methods” for details. Access data table for Figure 2
.SOURCE: CDC/NCHS, National Vital Statistics System.
In 2008, age-adjusted poisoning death rates varied by state, ranging from 7.6 to 30.8 per 100,000 population. In 20 states, the age-adjusted poisoning death rate was significantly higher than the U.S. rate of 13.4 deaths per 100,000 population.
The five states with the highest poisoning death rates were New Mexico (30.8), West Virginia (27.6), Alaska (24.2), Nevada (21.0), and Utah (20.8). In 43 states over 80% of poisoning deaths were caused by drugs (data not shown).
Opioid analgesics were involved in more than 40% of drug poisoning deaths in 2008.
Of the 36,500 drug poisoning deaths in 2008, more than 40% (14,800) involved opioid analgesics (Figure 3). For about one-third (12,400) of the drug poisoning deaths, the type of drug(s) involved was specified on the death certificate but it was not an opioid analgesic. The remaining 25% involved drugs, but the type of drugs involved was not specified on the death certificate (for example, "drug overdose" or "multiple drug intoxication" was written on the death certificate).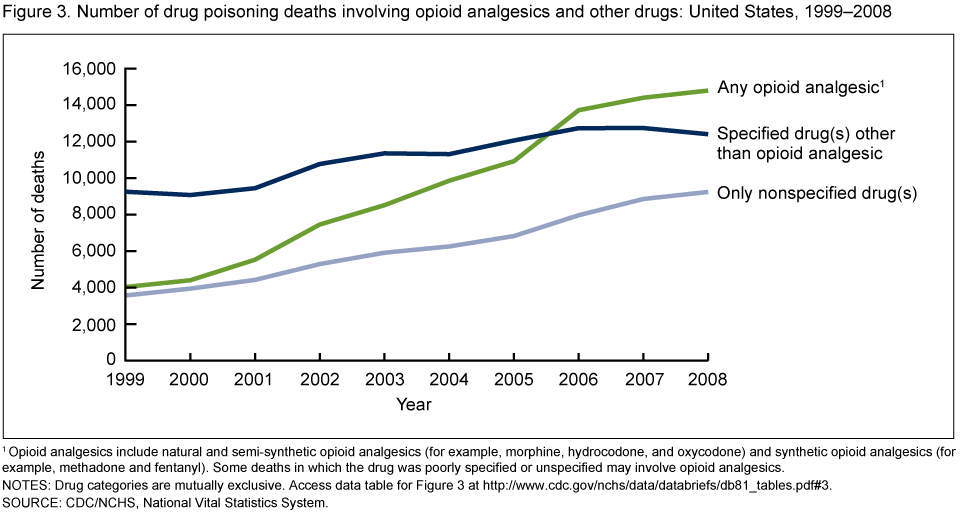
1Opioid analgesics include natural and semi-synthetic opioid analgesics (for example, morphine, hydrocodone, and oxycodone) and synthetic opioid analgesics (for example, methadone and fentanyl). Some deaths in which the drug was poorly specified or unspecified may involve opioid analgesics.
NOTES: Drug categories are mutually exclusive. Access data table for Figure 3
.SOURCE: CDC/NCHS, National Vital Statistics System.
From 1999 to 2008, the number of drug poisoning deaths involving opioid analgesics increased from about 4,000 to 14,800, more rapidly than deaths involving only other types of drugs or only nonspecified drugs.
From 1999 to 2008, the number of drug poisoning deaths involving only nonspecified drugs increased from about 3,600 to about 9,200. Some drug poisoning deaths for which the drug was not specified may involve opioid analgesics.
Natural and semi-synthetic opioid analgesics such as morphine, hydrocodone, and oxycodone were involved in over 9,100 drug poisoning deaths in 2008, up from about 2,700 in 1999.
Of the 14,800 drug poisoning deaths involving opioid analgesics in 2008, the majority involved natural and semi-synthetic opioid analgesics such as morphine, hydrocodone, and oxycodone. The number of drug poisoning deaths involving natural and semi-synthetic opioid analgesics increased steadily each year from about 2,700 deaths in 1999 to over 9,100 deaths in 2008 (Figure 4).The number of drug poisoning deaths involving methadone, which is a synthetic opioid analgesic used to treat opioid dependency as well as pain, increased sevenfold from about 800 deaths in 1999 to about 5,500 in 2007. Between 2007 and 2008, the number of deaths involving methadone decreased by nearly 600 deaths, the first decrease since 1999.
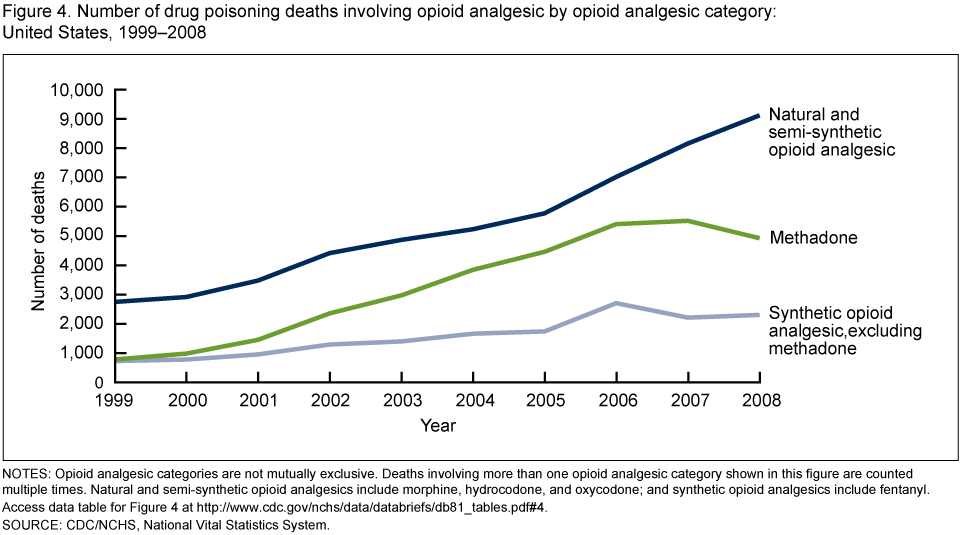
NOTES: Opioid analgesic categories are not mutually exclusive. Deaths involving more than one opioid analgesic category shown in this figure are counted multiple times. Natural and semi-synthetic opioid analgesics include morphine, hydrocodone, and oxycodone; and synthetic opioid analgesics include fentanyl. Access data table for Figure 4
. SOURCE: CDC/NCHS, National Vital Statistics System.
The number of drug poisoning deaths involving synthetic opioid analgesics other than methadone, such as fentanyl, tripled from about 700 in 1999 to 2,300 in 2008.
In 2008, the drug poisoning death rate was higher among those aged 45–54 years than among those in other age groups.
From 1999 to 2008, the drug poisoning death rate increased among all age groups. In 2004, the drug poisoning death rate among those aged 45–54 years surpassed the rate among those aged 35–44 years, and became the age group with the highest drug poisoning death rate (Figure 5).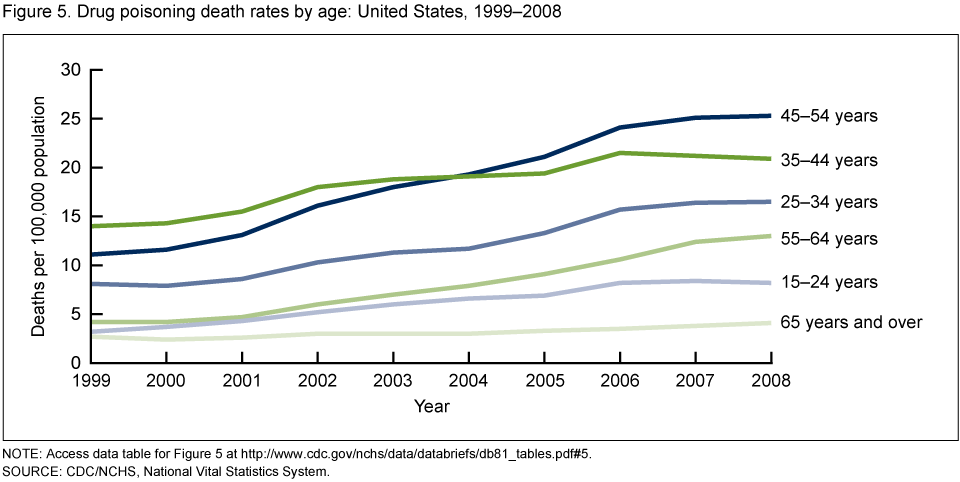
NOTE: Access data table for Figure 5
. SOURCE: CDC/NCHS, National Vital Statistics System.
From 1999 to 2008, the age-adjusted drug poisoning death rate increased for males and females and for all race and ethnicity groups (Appendix table). In 2008, the rate was higher for males than for females, and higher for non-Hispanic American Indian or Alaska Native and non-Hispanic white persons than for those in other race and ethnicity groups.
Appendix table. Age-adjusted drug poisoning death rates, by demographic characteristics and intent: United States, 1999–2008: see the original text please
Summary
In 2008, the number of poisoning deaths exceeded the number of motor vehicle traffic deaths and was the leading cause of injury death for the first time since at least 1980. During the past three decades, the poisoning death rate nearly tripled, while the motor vehicle traffic death rate decreased by one-half. During this period, the percentage of poisoning deaths that were caused by drugs increased from about 60% to about 90%.The population groups with the highest drug poisoning death rates in 2008 were males, people aged 45–54 years, and non-Hispanic white and American Indian or Alaska Native persons. The vast majority of drug poisoning deaths are unintentional (see Appendix table). Opioid analgesics were involved in more drug poisoning deaths than other specified drugs, including heroin and cocaine. Opioid analgesics were involved in nearly 15,000 deaths in 2008, while cocaine was involved in about 5,100 deaths and heroin was involved in about 3,000 deaths (data not shown). Deaths involving opioid analgesics may involve other drugs as well, including benzodiazepines (2).
In addition to an increase in the number of deaths caused by drug poisoning, increases in drug use, abuse, misuse, and nonfatal health outcomes have been observed. In the past two decades, there has been an increase in the distribution and medical use of prescription drugs, including opioid analgesics (3). From 1999 to 2008, the use of prescription medications increased (4). In 2007–2008, 48% of Americans used at least one prescription drug in the past month and 11% of Americans used five or more prescriptions in the past month. Analgesics for pain relief were among the common drugs taken by adults aged 20–59 years (4). In 2009–2010, over 5 million Americans reported using prescription pain relievers nonmedically in the past month (that is, without a doctor's prescription or only for the experience or feeling they caused), and the majority of people using prescription pain relievers nonmedically reported getting the drugs from friends or family (5,6). From 2004 to 2008, the estimated rate of emergency department visits involving nonmedical use of opioid analgesics doubled from 49 per 100,000 to 101 per 100,000 (7).
Government agencies and other organizations joined together to achieve great reductions in the number of deaths from motor vehicle crashes in the past three decades (8,9). A comprehensive approach, including improvements in the safety of vehicles; improvements in roadways; increased use of restraint systems, such as seat belts and child safety seats; reductions in speed; and also efforts to reduce driving under the influence of alcohol and drugs, contributed to the decline in motor vehicle related deaths (8,9). Using a comprehensive, multifaceted approach, it may be possible to reverse the trend in drug poisoning mortality.
Definitions
Injury deaths: Include deaths that are caused by forces external to the body. Examples of causes of injury death include drowning, fall, firearm, fire or burn, motor vehicle traffic, poisoning, and suffocation.Poisoning deaths: Include drug poisonings resulting from unintentional or intentional overdoses of a drug, being given the wrong drug, taking the wrong drug in error, or taking a drug inadvertently. Poisoning deaths also include poisoning resulting from other toxic substances, gases, or vapors.
Opioid analgesics: Drugs that are usually prescribed to relieve pain and include: Natural and semi-synthetic opioid analgesics such as morphine, codeine, hydrocodone, and oxycodone; methadone, which is a synthetic opioid analgesic used to treat opioid dependency as well as pain; and other synthetic opioid analgesics (excluding methadone) such as fentanyl and propoxyphene. Opium and heroin are not included in this class of drugs.
Data sources and methods
Estimates are based on the National Vital Statistics System multiple cause of death mortality files (10). Deaths were classified using the International Classification of Diseases (ICD), Tenth Revision (ICD–10) in 1999–2008 and the Ninth Revision of the ICD (ICD–9) in 1980–1998. Poisoning deaths were defined as having ICD–10 underlying cause of death code (UCOD): X40–X49, X60–X69, X85–X90, Y10–Y19, Y35.2, or *U01(.6–.7) and ICD–9 UCOD: E850.0–E869.9, E950.0–E952.9, E962(.0–.9), E972, or E980.0–E982.9. Drug poisoning deaths were defined as having ICD–10 UCOD: X40–X44 (unintentional), X60–X64 (suicide), X85 (homicide), Y10–Y14 (undetermined intent) and ICD–9 UCOD: E850–E858, E950.0–E950.5, E962.0, or E980.0–E980.5. Motor vehicle traffic deaths were defined as having ICD–10 UCOD: V02–V04(.1,.9), V09.2, V12–V14(.3–.9), V19(.4–.6), V20–V28(.3–.9), V29–V79(.4–.9), V80(.3–.5), V81–V82(.1), V83–V86(.0–.3), V87(.0–.8), or V89.2 and ICD–9 UCOD: E810.0–E819.9, E958.5, or E988.5. When the ICD–10 replaced ICD–9 in 1999, approximately 5% fewer deaths were classified as motor vehicle deaths and 2% more deaths were classified as poisoning deaths (11).The identification of individual drugs and drug classes involved in drug poisoning deaths is limited by the classification structure of the ICD. Trends involving individual drugs and drug classes begin with 1999 when the ICD–10 replaced ICD–9, because the classification of individual drugs and drug classes is not comparable between ICD revisions. Among deaths with drug poisoning as the underlying cause, the following ICD–10 codes indicate the type of drug(s) involved: only nonspecified drug(s) (only T50.9); specified drug(s) other than opioid analgesic (any of the codes T36–T50.8 other than T40.2–T40.4); and any opioid analgesic (any of the codes T40.2–T40.4); and natural and semi–synthetic opioid analgesic (T40.2); methadone (T40.3); synthetic opioid analgesic, excluding methadone (T40.4); heroin (T40.1); and cocaine (T40.5).
Age-adjusted death rates were calculated using the direct method and the 2000 standard population (10). To identify state rates that were significantly higher or lower than the overall U.S. rate, differences between national and state estimates were evaluated using two-sided significance tests at the 0.01 level. Georgia was excluded from this comparison because the cause of death was inconclusive for a high proportion of deaths in Georgia in the 2008 NVSS mortality file. When the national mortality file was closed to updates, the manner of death was pending for 8.8% of deaths and was assigned an ill-defined cause in 3.5% of deaths for Georgia as compared with 0.5% pending and 0.3% ill-defined for the nation. Poisoning deaths, which require lengthy investigations, are typically among the causes that remain pending at the close of the file.
Several factors related to death investigation and reporting may affect measurement of death rates involving specific drugs. At autopsy, toxicological lab tests may be performed to determine the type of legal and illegal drugs present. The substances tested for and circumstances in which the tests are performed vary by jurisdiction. Measurement errors related to these factors are more likely to affect substance specific death rates than the overall drug poisoning death rate.
About the authors
Margaret Warner, Li Hui Chen, and Diane M. Makuc are with the Centers for Disease Control and Prevention's (CDC) National Center for Health Statistics (NCHS), Office of Analysis and Epidemiology. Arialdi M. Miniño and Robert N. Anderson are with CDC, NCHS, Division of Vital Statistics.References
- Healthy People 2020 Topics and Objectives
. Accessed September 30, 2011.
- Warner M, Chen LH, Makuc DM. Increase in fatal poisonings involving opioid analgesics in the United States, 1999–2006. NCHS data brief, no 22. Hyattsville, MD: National Center for Health Statistics. 2009.
- Paulozzi L, Mack K, Rudd R, Jones C. Vital signs: Overdoses of prescription opioid pain relievers—United States, 1999–2008. MMWR, vol 60, 1487–92. 2011.
- Gu Q, Dilon CF, Burt VL. Prescription drug use continues to increase: U.S. prescription drug data for 2007–2008. NCHS data brief, no 42. Hyattsville, MD: National Center for Health Statistics. 2009.
- Substance Abuse and Mental Health Services Administration. The NSDUH Report: Trends in nonmedical use of prescription pain relievers: 2002 to 2007
- Substance Abuse and Mental Health Services Administration. Results from the 2010 National Survey on Drug Use and Health: Summary of National Findings, NSDUH Series H–41, HHS Publication No. (SMA) 11–4658
- Cai R, Crane E, Poneleit K, Paulozzi L. Emergency department visits involving nonmedical use of selected prescription drugs: United States, 2004–2008
- CDC. Motor-vehicle safety: A 20th century public health achievement (Reprinted from MMWR, vol 48, 369. 1999). JAMA-J Am Med Assoc 281(22):2080–82. 1999.
- Longthorne A, Subramanian R, Chen CL. An analysis of the significant decline in motor vehicle traffic fatalities in 2008
- Miniño AM, Murphy SL, Xu JQ, Kochanek KD. Deaths: Final data for 2008
- Bergen G, Chen L, Warner M, Fingerhut L. Injury in the United States: 2007 Chartbook. Hyattsville, MD: National Center for Health Statistics. 2008
Suggested citation
Warner M, Chen LH, Makuc DM, Anderson RN, Miniño AM. Drug poisoning deaths in the United States, 1980–2008. NCHS data brief, no 81. Hyattsville, MD: National Center for Health Statistics. 2011.Copyright information
All material appearing in this report is in the public domain and may be reproduced or copied without permission; citation as to source, however, is appreciated.National Center for Health Statistics
Edward J. Sondik, Ph.D., DirectorJennifer H. Madans, Ph.D., Associate Director for Science


.png)


No hay comentarios:
Publicar un comentario