
NCHS Data Brief
Number 71, August 2011
Consumption of Sugar Drinks in the United States, 2005–2008
On This Page
- Key findings
- On average, how many kilocalories from sugar drinks does the U.S. population consume?
- Does everyone consume sugar drinks?
- How many kilocalories from sugar drinks do people consume on a given day?
- Are there racial or ethnic differences in the percentage of total dietary kilocalories consumed from sugar drinks?
- Are there income differences in the percentage of total dietary kilocalories consumed from sugar drinks?
- Where do people consume sugar drinks and where are they obtained?
- Summary
- Definitions
- Data source and methods
- About the authors
- References
- Suggested citation
 (643 KB)
Cynthia L. Ogden, Ph.D., M.R.P.; Brian K. Kit, M.D., M.P.H.; Margaret D. Carroll, M.S.P.H.; and Sohyun Park, Ph.D., M.S.
Key findings
Data from the National Health and Nutrition Examination Survey, 2005–2008- Males consume more sugar drinks than females.
- Teenagers and young adults consume more sugar drinks than other age groups.
- Approximately one-half of the U.S. population consumes sugar drinks on any given day.
- Non-Hispanic black children and adolescents consume more sugar drinks in relation to their overall diet than their Mexican-American counterparts. Non-Hispanic black and Mexican-American adults consume more than non-Hispanic white adults.
- Low-income persons consume more sugar drinks in relation to their overall diet than those with higher income.
- Most of the sugar drinks consumed away from home are obtained from stores and not restaurants or schools.
Keywords: kilocalories, mean, income, National Health and Nutrition Examination Survey
On average, how many kilocalories from sugar drinks does the U.S. population consume?
Overall, males consume an average of 175 kcal from sugar drinks on any given day, while females consume 94 kcal. Mean consumption of sugar drinks is higher in males than females at all ages except among 2- to 5-year-olds. Consumption of sugar drinks increases until ages 12–19 years and then decreases with age. Consumption of sugar drinks is lowest among the oldest females (42 kcal per day) and highest among males aged 12–19 (273 kcal per day) (Figure 1). The age patterns of percentage of total daily kilocalories from sugar drinks (not shown) are similar to those for kilocalories from sugar drinks.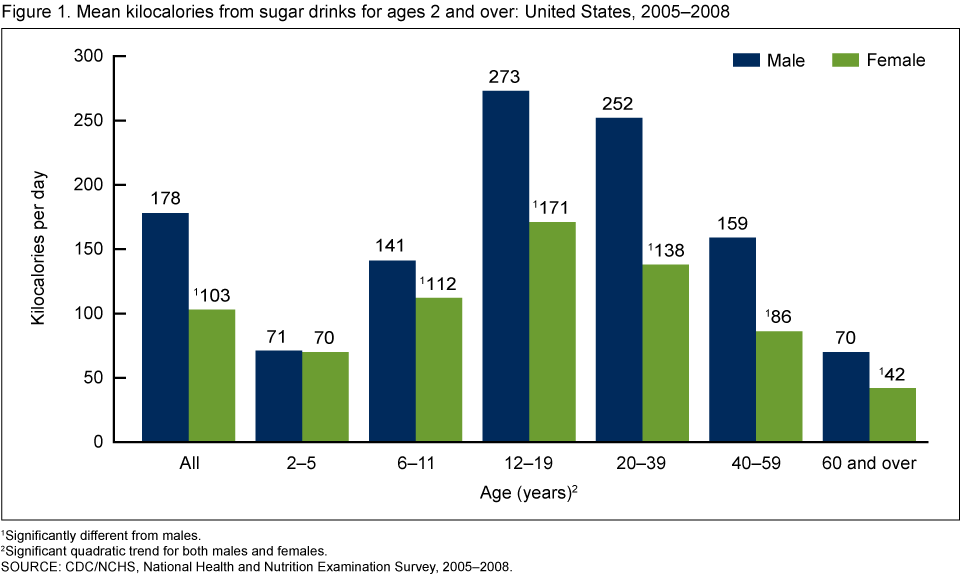
Does everyone consume sugar drinks?
Approximately one-half of the population aged 2 and older consumes sugar drinks on any given day. Among adult women, the percentage is lower, with 40% consuming sugar drinks on any given day, while among boys aged 2–19, 70% consume sugar drinks on any given day (Figure 2).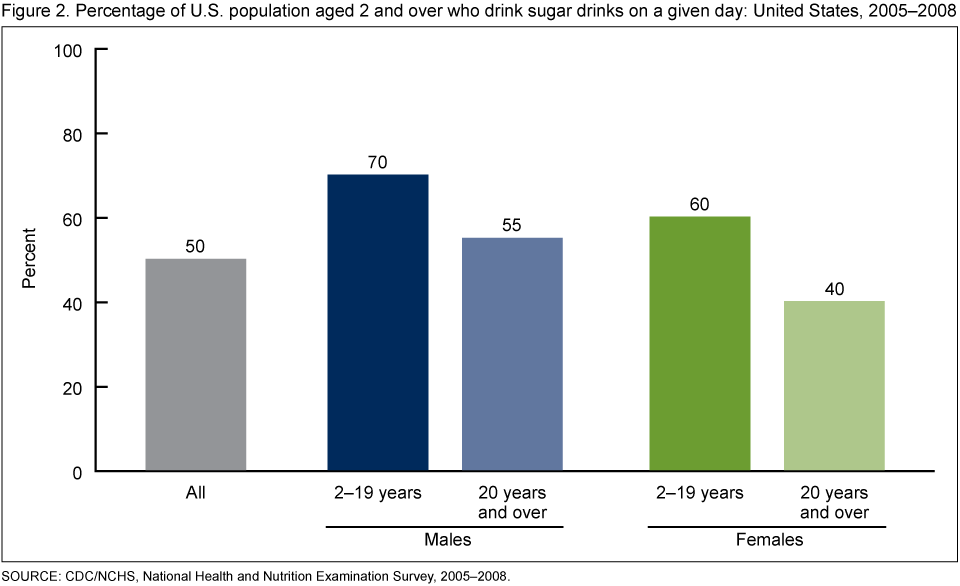
How many kilocalories from sugar drinks do people consume on a given day?
On a given day, there is a wide range of sugar-drink consumption. About 50% of the population consumes no sugar drinks; 25% consumes some sugar drinks but less than 200 kcal (more than one 12-oz can of cola); and 5% consumes at least 567 kcal from sugar drinks on any given day (more than four 12-oz cans of cola) (Figure 3).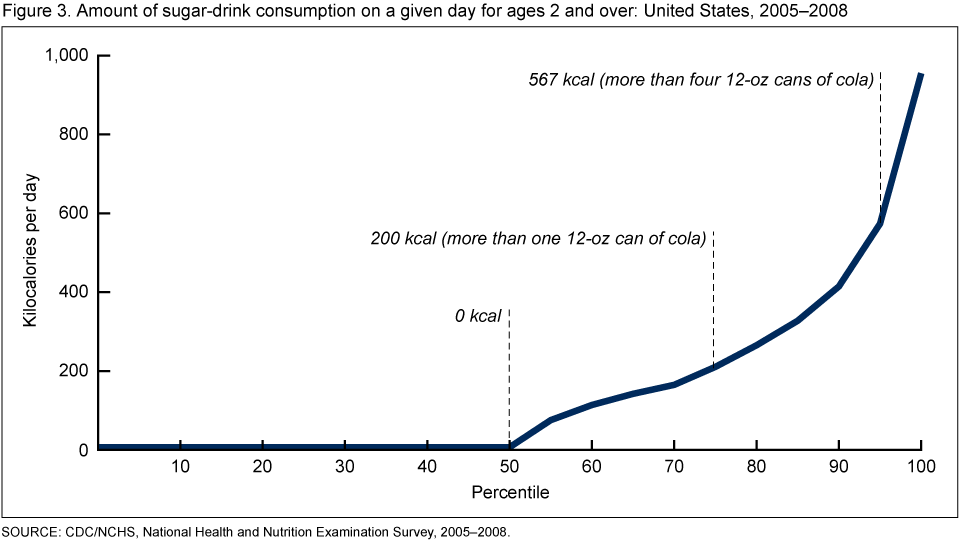
Are there racial or ethnic differences in the percentage of total dietary kilocalories consumed from sugar drinks?
Among non-Hispanic black children and adolescents, 8.5% of total kilocalories consumed in the diet are obtained from sugar drinks, higher than the 7.4% among Mexican-American children and adolescents. Among adults aged 20 and over, non-Hispanic white persons consume fewer sugar-drink kilocalories as a percentage of total kilocalories (5.3%) than do non-Hispanic black (8.6%) or Mexican-American persons (8.2%) (Figure 4).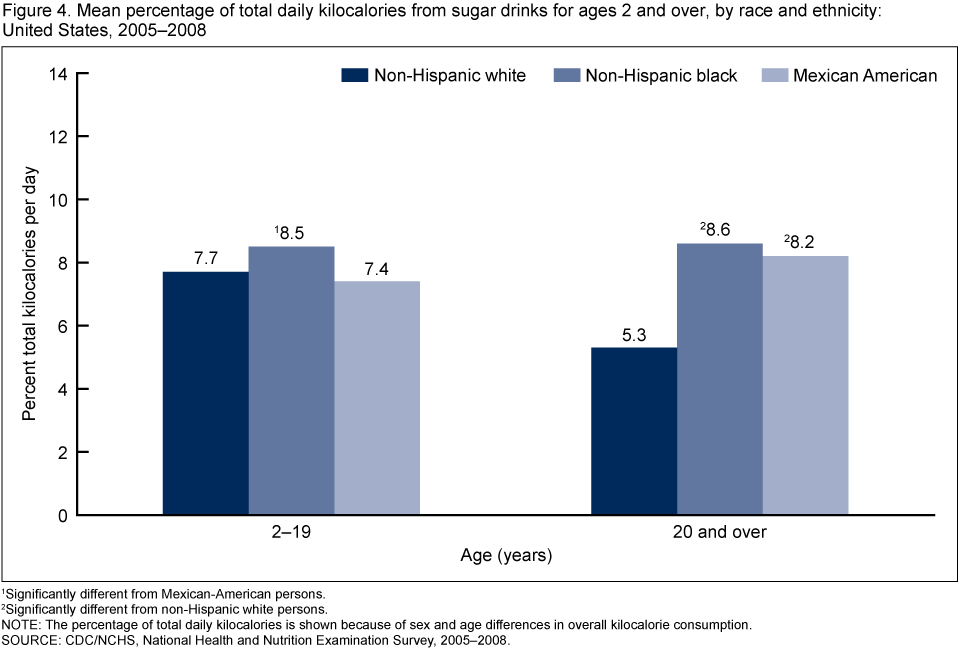
Are there income differences in the percentage of total dietary kilocalories consumed from sugar drinks?
Higher-income persons consume fewer kilocalories from sugar drinks as a percentage of total daily kilocalories than do lower-income individuals. Among children and adolescents in households with income below 130% of the poverty line, the mean percentage of total kilocalories consumed from sugar drinks is 8.2%, higher than the 6.7% consumed among those living at or above 350% of the poverty line. Similarly, among adults living below 130% of the poverty line, mean kilocalories from sugar drinks is 8.8% of total kilocalories; among those living between 130% and 350% of the poverty line, mean kilocalories from sugar drinks is 6.2% of total kilocalories; and among those at or above 350% of the poverty line, mean kilocalories is 4.4% of total kilocalories (Figure 5).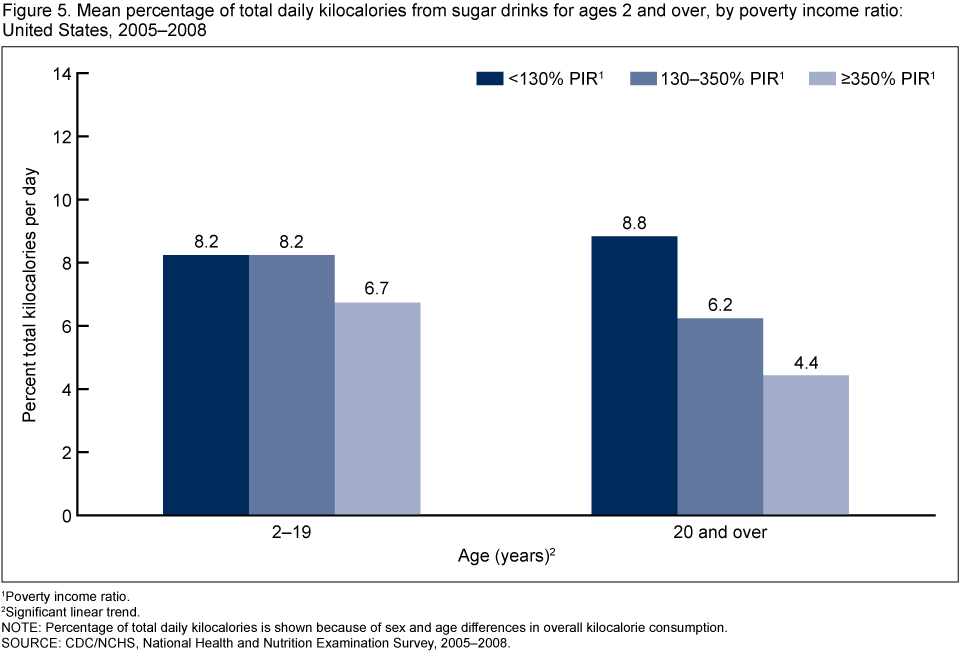
Where do people consume sugar drinks and where are they obtained?
More than one-half of sugar-drink kilocalories (52%) are consumed in the home. Of these sugar-drink kilocalories, the vast majority is purchased in stores (92%), and just over 6% is purchased in restaurants or fast-food establishments. Of the 48% consumed away from home, 43% are purchased in stores, 35.5% in restaurants or fast-food establishments, and 1.4% in schools or day-care settings. Over 20% of sugar-drink kilocalories consumed away from home are obtained in other places such as vending machines, cafeterias, street vendors, and community food programs, among others (Figure 6).
Summary
One-half of the U.S. population consumes sugar drinks on any given day, and 25% consumes at least 200 kcal (more than one 12-oz can of cola).Sugar-drink consumption differs by sex, age, race and ethnicity, and income. For example, males consume more than females, and teenagers and young adults consume more than other age groups. Among adults, non-Hispanic black and Mexican-American persons consume more than non-Hispanic white persons, and low-income individuals consume more sugar drinks in relation to their total diet than higher-income individuals.
More than one-half of sugar drinks are consumed in the home. Most sugar drinks consumed away from home are obtained from stores, but more than one-third are obtained in restaurants or fast-food establishments.
Definitions
Kilocalories: A measure representing dietary energy or caloric intake. Kilocalories from sugar drinks are energy from sugar drinks. Percentage of daily kilocalories from sugar drinks is the percentage of total daily energy obtained from sugar drinks.Sugar drinks: For these analyses, sugar drinks include fruit drinks, sodas, energy drinks, sports drinks, and sweetened bottled waters, consistent with definitions reported by the National Cancer Institute (8). Sugar drinks do not include diet drinks, 100% fruit juice, sweetened teas, and flavored milks. Population estimates of sugar-drink kilocalories are based on data from one in-person, 24-hour dietary recall interview.
Location of sugar-drink consumption: Respondents to the 24-hour dietary recall interview were asked if each reported food was consumed at home or away from home.
Source of sugar drinks: Respondents to the 24-hour dietary recall interview were asked where they obtained each food consumed. To determine source of food, respondents were offered 26 options, categorized for this brief as store, restaurant (including fast-food), school or child care, and other.
Poverty income ratio (PIR): A measure representing the ratio of household income to the poverty threshold after accounting for inflation and family size. In 2008, a PIR of 350% was equivalent to approximately $77,000 for a family of four; a PIR of 130% was equivalent to approximately $29,000 for a family of four. In 2008, median household income was approximately $50,000, and 13.2% of the population lived below the poverty level, based on U.S. Census Bureau data (9).The cut point for participation in the Supplemental Nutrition Assistance Program is 130% of the poverty level.
Data source and methods
Data from the National Health and Nutrition Examination Survey (NHANES) were used for these analyses. NHANES is a cross-sectional survey designed to monitor the health and nutritional status of the civilian, noninstitutionalized U.S. population (10). The survey consists of interviews conducted in participants' homes, standardized physical examinations in mobile examination centers, and laboratory tests utilizing blood and urine specimens provided by participants during the physical examination. Dietary information for this analysis was obtained via an in-person, 24-hour dietary recall interview in the mobile examination center.The NHANES sample is selected through a complex, multistage design that includes selection of primary sampling units (counties), household segments within the counties, households within segments, and, finally, sample persons from selected households. The sample design includes oversampling to obtain reliable estimates of health and nutritional measures for population subgroups. In 2005–2006, African-American and Mexican-American subgroups were oversampled. In 2007–2008, African-American and overall Latino subgroups were oversampled, with sufficient sample sizes for separate analysis of the Mexican-American subgroup. In 1999, NHANES became a continuous survey, fielded on an ongoing basis. Each year of data collection is based on a representative sample covering all ages of the civilian, noninstitutionalized population. Public-use data files are released in 2-year cycles.
Sample weights, which account for the differential probabilities of selection, nonresponse, and noncoverage, were incorporated into the estimation process. The standard errors of the percentages were estimated using Taylor Series Linearization, a method that incorporates the sample weights and sample design.
Mean estimates for adults were age adjusted to the 2000 U.S. standard population using three age groups: 20–39, 40–59, and 60 and over. Differences between groups were evaluated using a univariate t statistic at the p < 0.05 significance level. Tests of age trends were done using the p < 0.05 significance level. All differences reported are statistically significant unless otherwise indicated. Statistical analyses were conducted using the SAS System for Windows release 9.2 (SAS Institute Inc., Cary, N.C.) and SUDAAN release 10.0 (RTI International, Research Triangle Park, N.C.).
About the authors
Cynthia L. Ogden, Brian K. Kit, and Margaret D. Carroll are with the Centers for Disease Control and Prevention's (CDC) National Center for Health Statistics, Division of Health and Nutrition Examination Surveys. Sohyun Park is with CDC's National Center for Chronic Disease Prevention and Health Promotion, Division of Nutrition, Physical Activity, and Obesity.References
- Enns CW, Goldman JD, Cook A. Trends in food and nutrient intakes by adults: NFCS 1977–78, CSFII 1989-91, and CSFII 1994-95. Fam Econ Nutr Rev 10(4):2–15. 1997.
- French SA, Lin BH, Guthrie JF. National trends in soft drink consumption among children and adolescents age 6 to 17 years: Prevalence, amounts, and sources, 1977/1978 to 1994/1998. J Am Diet Assoc 103(10):1326–31. 2003.
- Sebastian RS, Cleveland LE, Goldman JD, Moshfegh AJ. Trends in the food intakes of children 1977–2002. Consumer Interests Annual 52:433–4. 2006.
- Malik VS, Schulze MB, Hu FB. Intake of sugar-sweetened beverages and weight gain: A systematic review. Am J Clin Nutr 84(2):274–88. 2006.
- Vartanian LR, Schwartz MB, Brownell KD. Effects of soft drink consumption on nutrition and health: A systematic review and meta-analysis. Am J Public Health 97(4):667–75. 2007.
- U.S. Department of Agriculture and U.S. Department of Health and Human Services. Dietary guidelines for Americans, 2010
. 7th ed. Washington, DC: U.S. Government Printing Office. 2010.
- Lloyd-Jones DM, Hong Y, Labarthe D, Mozaffarian D, Appel LJ, Van HL, et al. Defining and setting national goals for cardiovascular health promotion and disease reduction: The American Heart Association's strategic impact goal through 2020 and beyond. Circulation 121(4):586–613. 2010.
- Reedy J, Krebs-Smith SM. Dietary sources of energy, solid fats, and added sugars among children and adolescents in the United States. J Am Diet Assoc 110(10):1477–84. 2010.
- DeNavas-Walt C, Proctor BD, Smith JC. Income, poverty, and health insurance coverage in the United States: 2008
- National Center for Health Statistics. National Health and Nutrition Examination Survey 2011.
Suggested citation
Ogden CL, Kit BK, Carroll MD, Park S. Consumption of sugar drinks in the United States, 2005–2008. NCHS data brief, no 71. Hyattsville, MD: National Center for Health Statistics. 2011.Copyright information
All material appearing in this report is in the public domain and may be reproduced or copied without permission; citation as to source, however, is appreciated.National Center for Health Statistics
Edward J. Sondik, Ph.D., DirectorJennifer H. Madans, Ph.D., Associate Director for Science
Division of Health and Nutrition Examination Surveys
Clifford L. Johnson, M.S.P.H., DirectorProducts - Data Briefs - Number 71 - August 2011


.png)


No hay comentarios:
Publicar un comentario